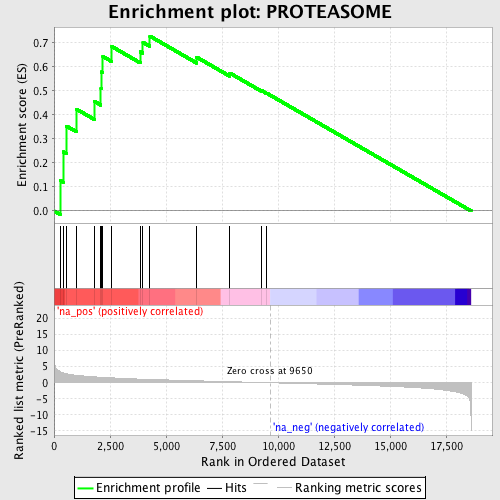
Profile of the Running ES Score & Positions of GeneSet Members on the Rank Ordered List
| Dataset | set04_transDMproB_versus_LMproB |
| Phenotype | NoPhenotypeAvailable |
| Upregulated in class | na_pos |
| GeneSet | PROTEASOME |
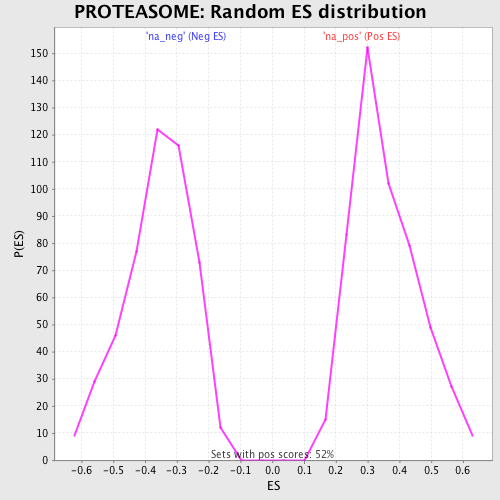
| Enrichment Score (ES) | 0.728212 |
| Normalized Enrichment Score (NES) | 2.0512748 |
| Nominal p-value | 0.0 |
| FDR q-value | 0.019305063 |
| FWER p-Value | 0.039 |
| PROBE | GENE SYMBOL | GENE_TITLE | RANK IN GENE LIST | RANK METRIC SCORE | RUNNING ES | CORE ENRICHMENT | |
|---|---|---|---|---|---|---|---|
| 1 | PSMB1 | 271 | 3.438 | 0.1272 | Yes | ||
| 2 | PSMB6 | 406 | 3.058 | 0.2461 | Yes | ||
| 3 | PSMB10 | 554 | 2.796 | 0.3535 | Yes | ||
| 4 | PSMB9 | 1005 | 2.291 | 0.4238 | Yes | ||
| 5 | PSMB2 | 1796 | 1.824 | 0.4565 | Yes | ||
| 6 | PSMB3 | 2090 | 1.688 | 0.5104 | Yes | ||
| 7 | PSMA5 | 2104 | 1.682 | 0.5790 | Yes | ||
| 8 | PSMB8 | 2176 | 1.657 | 0.6435 | Yes | ||
| 9 | PSMA3 | 2575 | 1.524 | 0.6850 | Yes | ||
| 10 | PSMA4 | 3845 | 1.130 | 0.6633 | Yes | ||
| 11 | PSMB5 | 3966 | 1.100 | 0.7023 | Yes | ||
| 12 | PSMA6 | 4276 | 1.032 | 0.7282 | Yes | ||
| 13 | PSMA2 | 6367 | 0.596 | 0.6404 | No | ||
| 14 | PSMB4 | 7842 | 0.322 | 0.5745 | No | ||
| 15 | PSMA7 | 9241 | 0.077 | 0.5025 | No | ||
| 16 | PSMB7 | 9486 | 0.035 | 0.4908 | No |