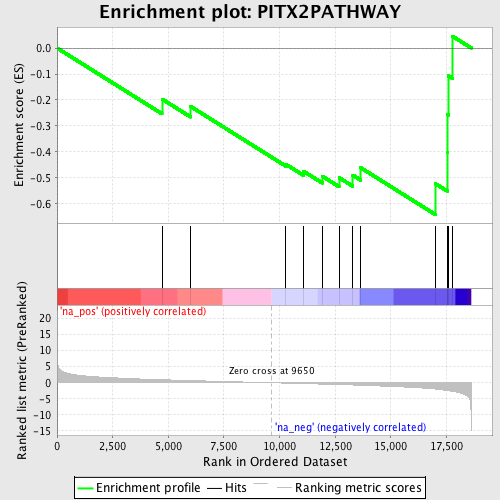
Profile of the Running ES Score & Positions of GeneSet Members on the Rank Ordered List
| Dataset | set04_transDMproB_versus_LMproB |
| Phenotype | NoPhenotypeAvailable |
| Upregulated in class | na_neg |
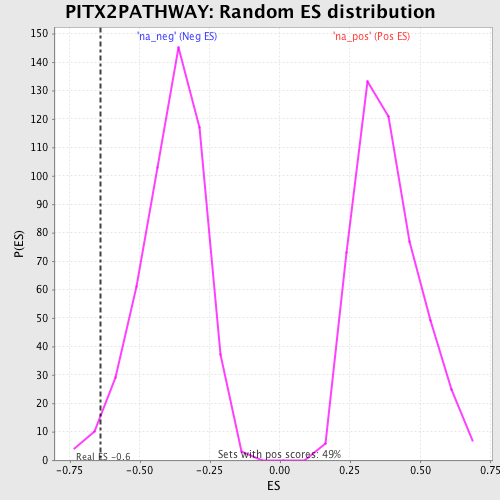
| GeneSet | PITX2PATHWAY |
| Enrichment Score (ES) | -0.6412418 |
| Normalized Enrichment Score (NES) | -1.6636565 |
| Nominal p-value | 0.017681729 |
| FDR q-value | 0.3527594 |
| FWER p-Value | 0.955 |
| PROBE | GENE SYMBOL | GENE_TITLE | RANK IN GENE LIST | RANK METRIC SCORE | RUNNING ES | CORE ENRICHMENT | |
|---|---|---|---|---|---|---|---|
| 1 | PITX2 | 4716 | 0.932 | -0.1966 | No | ||
| 2 | FZD1 | 6003 | 0.665 | -0.2251 | No | ||
| 3 | HTATIP | 10286 | -0.118 | -0.4481 | No | ||
| 4 | GSK3B | 11078 | -0.260 | -0.4748 | No | ||
| 5 | HDAC1 | 11922 | -0.428 | -0.4940 | No | ||
| 6 | PPARBP | 12675 | -0.573 | -0.4995 | No | ||
| 7 | WNT1 | 13293 | -0.700 | -0.4899 | No | ||
| 8 | APC | 13647 | -0.781 | -0.4612 | No | ||
| 9 | LDB1 | 16997 | -1.951 | -0.5222 | Yes | ||
| 10 | CREBBP | 17538 | -2.415 | -0.4038 | Yes | ||
| 11 | DVL1 | 17544 | -2.427 | -0.2560 | Yes | ||
| 12 | LEF1 | 17590 | -2.480 | -0.1071 | Yes | ||
| 13 | AXIN1 | 17761 | -2.658 | 0.0460 | Yes |