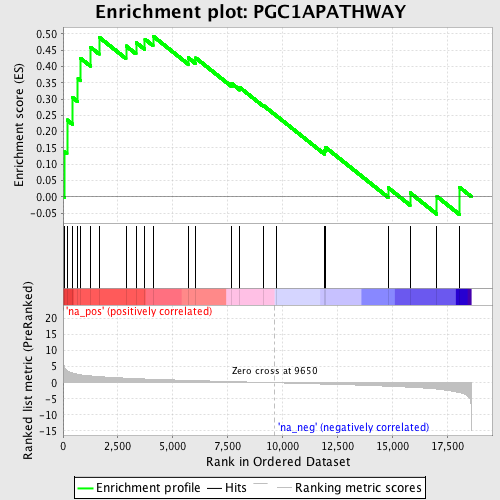
Profile of the Running ES Score & Positions of GeneSet Members on the Rank Ordered List
| Dataset | set04_transDMproB_versus_LMproB |
| Phenotype | NoPhenotypeAvailable |
| Upregulated in class | na_pos |
| GeneSet | PGC1APATHWAY |
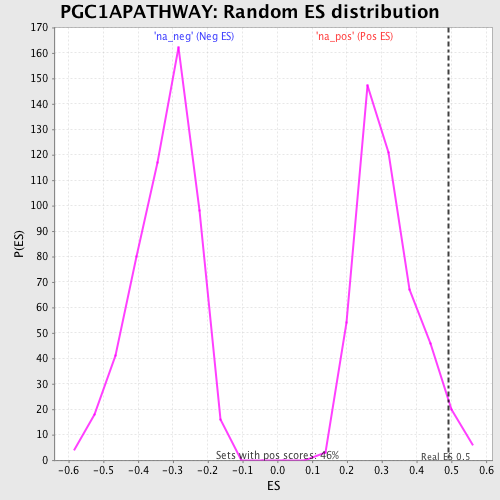
| Enrichment Score (ES) | 0.49296224 |
| Normalized Enrichment Score (NES) | 1.5569344 |
| Nominal p-value | 0.032327585 |
| FDR q-value | 0.34541386 |
| FWER p-Value | 1.0 |
| PROBE | GENE SYMBOL | GENE_TITLE | RANK IN GENE LIST | RANK METRIC SCORE | RUNNING ES | CORE ENRICHMENT | |
|---|---|---|---|---|---|---|---|
| 1 | CAMK1G | 53 | 5.162 | 0.1383 | Yes | ||
| 2 | MEF2A | 178 | 3.816 | 0.2359 | Yes | ||
| 3 | CALM2 | 433 | 3.005 | 0.3044 | Yes | ||
| 4 | CAMK2A | 677 | 2.624 | 0.3631 | Yes | ||
| 5 | CAMK1 | 793 | 2.494 | 0.4251 | Yes | ||
| 6 | PPP3CA | 1244 | 2.131 | 0.4592 | Yes | ||
| 7 | YWHAH | 1639 | 1.895 | 0.4898 | Yes | ||
| 8 | ESRRA | 2867 | 1.428 | 0.4629 | Yes | ||
| 9 | MEF2B | 3324 | 1.285 | 0.4735 | Yes | ||
| 10 | MEF2C | 3730 | 1.161 | 0.4834 | Yes | ||
| 11 | CAMK2D | 4099 | 1.072 | 0.4930 | Yes | ||
| 12 | SYT1 | 5701 | 0.725 | 0.4267 | No | ||
| 13 | CAMK4 | 6048 | 0.655 | 0.4260 | No | ||
| 14 | PPARA | 7689 | 0.349 | 0.3473 | No | ||
| 15 | HDAC5 | 8057 | 0.281 | 0.3353 | No | ||
| 16 | SLC2A4 | 9144 | 0.094 | 0.2794 | No | ||
| 17 | PPP3CB | 9709 | -0.011 | 0.2494 | No | ||
| 18 | CAMK2G | 11911 | -0.425 | 0.1427 | No | ||
| 19 | CAMK2B | 11957 | -0.433 | 0.1521 | No | ||
| 20 | CALM3 | 14815 | -1.086 | 0.0281 | No | ||
| 21 | MEF2D | 15813 | -1.397 | 0.0127 | No | ||
| 22 | CALM1 | 17037 | -1.987 | 0.0012 | No | ||
| 23 | PPP3CC | 18065 | -3.060 | 0.0296 | No |