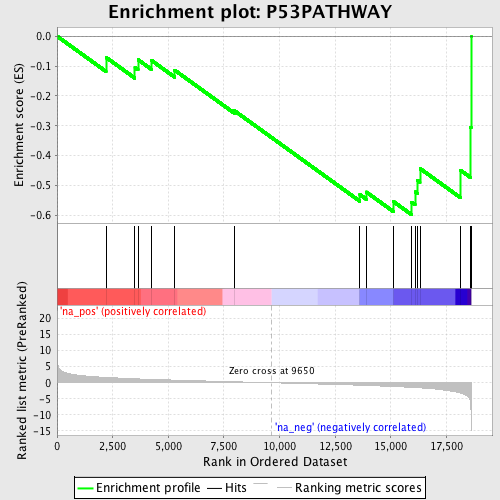
Profile of the Running ES Score & Positions of GeneSet Members on the Rank Ordered List
| Dataset | set04_transDMproB_versus_LMproB |
| Phenotype | NoPhenotypeAvailable |
| Upregulated in class | na_neg |
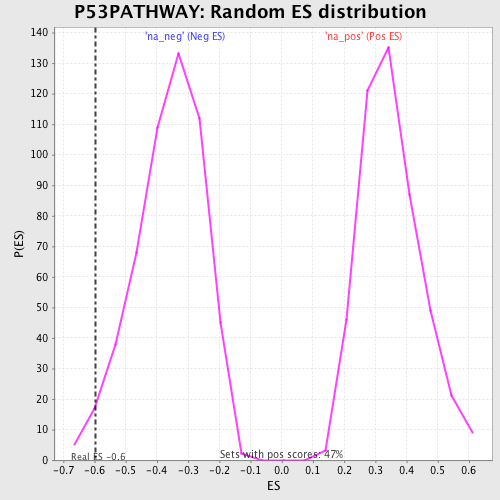
| GeneSet | P53PATHWAY |
| Enrichment Score (ES) | -0.59687537 |
| Normalized Enrichment Score (NES) | -1.6555568 |
| Nominal p-value | 0.02079395 |
| FDR q-value | 0.34020457 |
| FWER p-Value | 0.96 |
| PROBE | GENE SYMBOL | GENE_TITLE | RANK IN GENE LIST | RANK METRIC SCORE | RUNNING ES | CORE ENRICHMENT | |
|---|---|---|---|---|---|---|---|
| 1 | CDKN1A | 2200 | 1.649 | -0.0709 | No | ||
| 2 | MDM2 | 3499 | 1.227 | -0.1054 | No | ||
| 3 | ATM | 3638 | 1.186 | -0.0787 | No | ||
| 4 | PCNA | 4232 | 1.042 | -0.0806 | No | ||
| 5 | GADD45A | 5285 | 0.815 | -0.1137 | No | ||
| 6 | RB1 | 7963 | 0.297 | -0.2491 | No | ||
| 7 | CCND1 | 13609 | -0.772 | -0.5304 | No | ||
| 8 | APAF1 | 13895 | -0.840 | -0.5216 | No | ||
| 9 | CCNE1 | 15120 | -1.169 | -0.5538 | No | ||
| 10 | TIMP3 | 15923 | -1.439 | -0.5555 | Yes | ||
| 11 | E2F1 | 16090 | -1.502 | -0.5213 | Yes | ||
| 12 | CDK4 | 16191 | -1.548 | -0.4821 | Yes | ||
| 13 | CDK2 | 16312 | -1.588 | -0.4429 | Yes | ||
| 14 | BCL2 | 18142 | -3.196 | -0.4493 | Yes | ||
| 15 | BAX | 18573 | -5.849 | -0.3043 | Yes | ||
| 16 | TP53 | 18610 | -10.661 | 0.0003 | Yes |