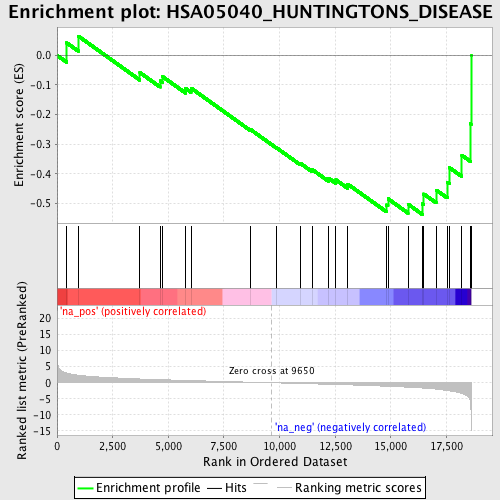
Profile of the Running ES Score & Positions of GeneSet Members on the Rank Ordered List
| Dataset | set04_transDMproB_versus_LMproB |
| Phenotype | NoPhenotypeAvailable |
| Upregulated in class | na_neg |
| GeneSet | HSA05040_HUNTINGTONS_DISEASE |
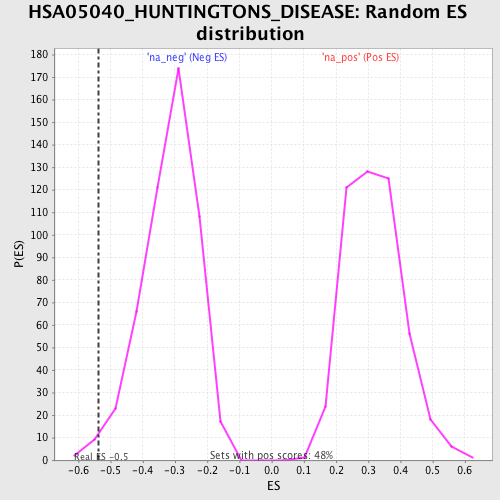
| Enrichment Score (ES) | -0.5377618 |
| Normalized Enrichment Score (NES) | -1.701821 |
| Nominal p-value | 0.011538462 |
| FDR q-value | 0.32598272 |
| FWER p-Value | 0.902 |
| PROBE | GENE SYMBOL | GENE_TITLE | RANK IN GENE LIST | RANK METRIC SCORE | RUNNING ES | CORE ENRICHMENT | |
|---|---|---|---|---|---|---|---|
| 1 | CALM2 | 433 | 3.005 | 0.0423 | No | ||
| 2 | IFT57 | 955 | 2.332 | 0.0652 | No | ||
| 3 | CLTA | 3721 | 1.163 | -0.0582 | No | ||
| 4 | CLTB | 4628 | 0.952 | -0.0861 | No | ||
| 5 | GAPDH | 4727 | 0.930 | -0.0711 | No | ||
| 6 | HAP1 | 5777 | 0.708 | -0.1121 | No | ||
| 7 | CASP3 | 6020 | 0.661 | -0.1107 | No | ||
| 8 | CALML3 | 8676 | 0.174 | -0.2497 | No | ||
| 9 | CBS | 9881 | -0.047 | -0.3134 | No | ||
| 10 | RASA1 | 10943 | -0.237 | -0.3653 | No | ||
| 11 | CLTC | 11467 | -0.337 | -0.3861 | No | ||
| 12 | CASP1 | 12196 | -0.480 | -0.4147 | No | ||
| 13 | HIP1 | 12532 | -0.545 | -0.4209 | No | ||
| 14 | GRB2 | 13058 | -0.653 | -0.4348 | No | ||
| 15 | CALM3 | 14815 | -1.086 | -0.5056 | Yes | ||
| 16 | TGM2 | 14874 | -1.100 | -0.4847 | Yes | ||
| 17 | CASP6 | 15775 | -1.380 | -0.5030 | Yes | ||
| 18 | BDNF | 16422 | -1.644 | -0.5019 | Yes | ||
| 19 | CASP8 | 16479 | -1.669 | -0.4685 | Yes | ||
| 20 | CALM1 | 17037 | -1.987 | -0.4551 | Yes | ||
| 21 | CREBBP | 17538 | -2.415 | -0.4293 | Yes | ||
| 22 | NCOR1 | 17634 | -2.517 | -0.3794 | Yes | ||
| 23 | DCTN1 | 18194 | -3.290 | -0.3377 | Yes | ||
| 24 | BAX | 18573 | -5.849 | -0.2304 | Yes | ||
| 25 | TP53 | 18610 | -10.661 | 0.0003 | Yes |