Profile of the Running ES Score & Positions of GeneSet Members on the Rank Ordered List
| Dataset | set04_transDMproB_versus_LMproB |
| Phenotype | NoPhenotypeAvailable |
| Upregulated in class | na_pos |
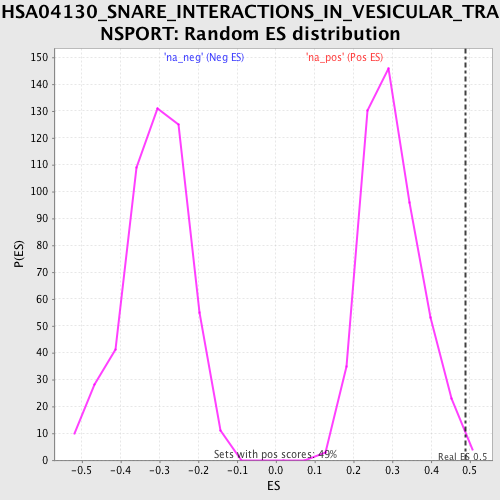
| GeneSet | HSA04130_SNARE_INTERACTIONS_IN_VESICULAR_TRANSPORT |
| Enrichment Score (ES) | 0.48997235 |
| Normalized Enrichment Score (NES) | 1.640222 |
| Nominal p-value | 0.006122449 |
| FDR q-value | 0.25491062 |
| FWER p-Value | 0.972 |
| PROBE | GENE SYMBOL | GENE_TITLE | RANK IN GENE LIST | RANK METRIC SCORE | RUNNING ES | CORE ENRICHMENT | |
|---|---|---|---|---|---|---|---|
| 1 | BET1L | 64 | 4.958 | 0.0887 | Yes | ||
| 2 | VAMP5 | 73 | 4.806 | 0.1776 | Yes | ||
| 3 | SEC22B | 395 | 3.089 | 0.2178 | Yes | ||
| 4 | STX8 | 502 | 2.894 | 0.2658 | Yes | ||
| 5 | VAMP4 | 532 | 2.844 | 0.3171 | Yes | ||
| 6 | VTI1A | 834 | 2.446 | 0.3464 | Yes | ||
| 7 | VAMP8 | 1342 | 2.072 | 0.3576 | Yes | ||
| 8 | STX11 | 1365 | 2.059 | 0.3947 | Yes | ||
| 9 | STX6 | 1464 | 1.989 | 0.4264 | Yes | ||
| 10 | STX7 | 1574 | 1.931 | 0.4565 | Yes | ||
| 11 | VTI1B | 1617 | 1.909 | 0.4897 | Yes | ||
| 12 | GOSR2 | 2184 | 1.654 | 0.4900 | Yes | ||
| 13 | GOSR1 | 2732 | 1.474 | 0.4879 | No | ||
| 14 | VAMP3 | 3256 | 1.302 | 0.4840 | No | ||
| 15 | SNAP29 | 3726 | 1.162 | 0.4804 | No | ||
| 16 | SNAP23 | 4611 | 0.956 | 0.4506 | No | ||
| 17 | STX12 | 5765 | 0.711 | 0.4018 | No | ||
| 18 | STX3 | 7363 | 0.408 | 0.3234 | No | ||
| 19 | SNAP25 | 11173 | -0.282 | 0.1238 | No | ||
| 20 | BET1 | 11587 | -0.360 | 0.1083 | No | ||
| 21 | STX5 | 13761 | -0.811 | 0.0064 | No | ||
| 22 | STX16 | 13837 | -0.828 | 0.0178 | No | ||
| 23 | VAMP1 | 14250 | -0.931 | 0.0129 | No | ||
| 24 | BNIP1 | 15373 | -1.246 | -0.0243 | No | ||
| 25 | STX17 | 15931 | -1.442 | -0.0274 | No | ||
| 26 | STX4 | 16193 | -1.548 | -0.0127 | No | ||
| 27 | STX2 | 17468 | -2.349 | -0.0376 | No | ||
| 28 | STX18 | 17536 | -2.413 | 0.0037 | No | ||
| 29 | VAMP2 | 17961 | -2.926 | 0.0352 | No |