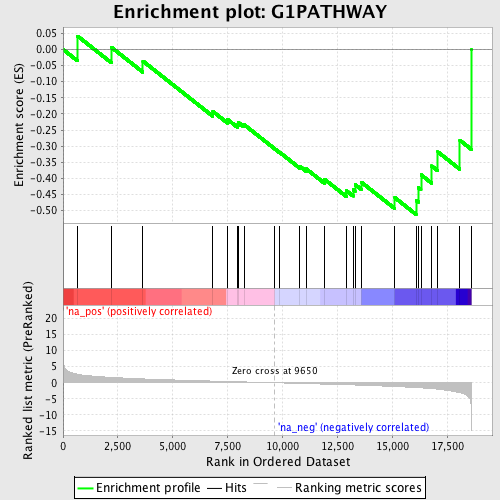
Profile of the Running ES Score & Positions of GeneSet Members on the Rank Ordered List
| Dataset | set04_transDMproB_versus_LMproB |
| Phenotype | NoPhenotypeAvailable |
| Upregulated in class | na_neg |
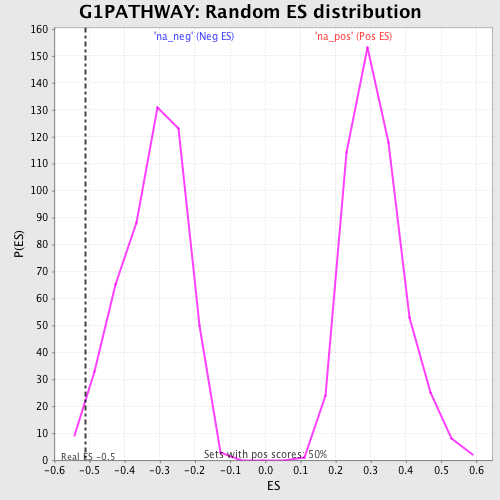
| GeneSet | G1PATHWAY |
| Enrichment Score (ES) | -0.51196706 |
| Normalized Enrichment Score (NES) | -1.5989596 |
| Nominal p-value | 0.01992032 |
| FDR q-value | 0.35514757 |
| FWER p-Value | 0.994 |
| PROBE | GENE SYMBOL | GENE_TITLE | RANK IN GENE LIST | RANK METRIC SCORE | RUNNING ES | CORE ENRICHMENT | |
|---|---|---|---|---|---|---|---|
| 1 | CDKN2A | 661 | 2.646 | 0.0415 | No | ||
| 2 | CDKN1A | 2200 | 1.649 | 0.0068 | No | ||
| 3 | ATM | 3638 | 1.186 | -0.0360 | No | ||
| 4 | CDKN2B | 6825 | 0.514 | -0.1924 | No | ||
| 5 | CDKN1B | 7498 | 0.383 | -0.2174 | No | ||
| 6 | RB1 | 7963 | 0.297 | -0.2337 | No | ||
| 7 | DHFR | 7995 | 0.291 | -0.2269 | No | ||
| 8 | CCNA1 | 8247 | 0.249 | -0.2332 | No | ||
| 9 | TFDP1 | 9654 | -0.002 | -0.3087 | No | ||
| 10 | TGFB2 | 9851 | -0.042 | -0.3181 | No | ||
| 11 | ATR | 10794 | -0.209 | -0.3627 | No | ||
| 12 | GSK3B | 11078 | -0.260 | -0.3703 | No | ||
| 13 | HDAC1 | 11922 | -0.428 | -0.4032 | No | ||
| 14 | TGFB3 | 12917 | -0.623 | -0.4385 | No | ||
| 15 | CDK6 | 13219 | -0.686 | -0.4348 | No | ||
| 16 | TGFB1 | 13308 | -0.704 | -0.4190 | No | ||
| 17 | CCND1 | 13609 | -0.772 | -0.4127 | No | ||
| 18 | CCNE1 | 15120 | -1.169 | -0.4598 | No | ||
| 19 | E2F1 | 16090 | -1.502 | -0.4682 | Yes | ||
| 20 | CDK4 | 16191 | -1.548 | -0.4286 | Yes | ||
| 21 | CDK2 | 16312 | -1.588 | -0.3888 | Yes | ||
| 22 | CDC25A | 16797 | -1.837 | -0.3613 | Yes | ||
| 23 | SKP2 | 17079 | -2.016 | -0.3178 | Yes | ||
| 24 | ABL1 | 18084 | -3.088 | -0.2818 | Yes | ||
| 25 | TP53 | 18610 | -10.661 | 0.0003 | Yes |