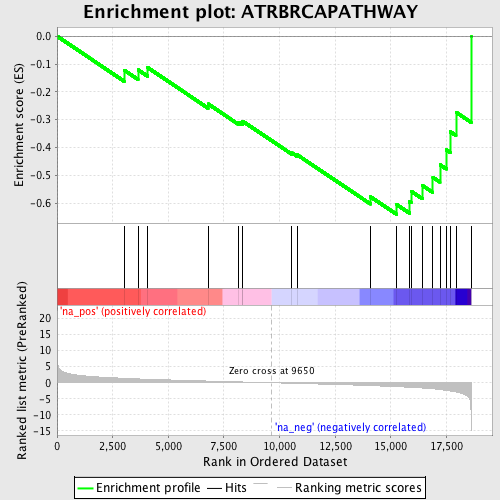
Profile of the Running ES Score & Positions of GeneSet Members on the Rank Ordered List
| Dataset | set04_transDMproB_versus_LMproB |
| Phenotype | NoPhenotypeAvailable |
| Upregulated in class | na_neg |
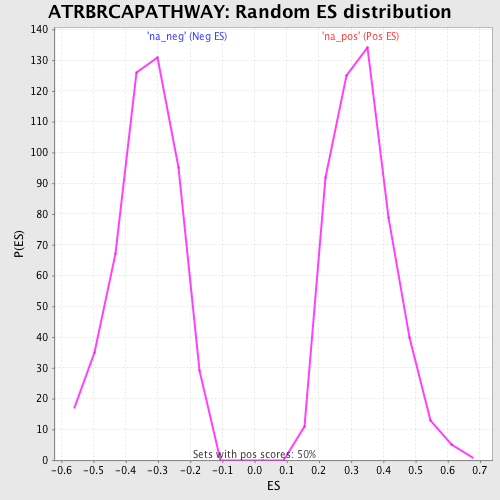
| GeneSet | ATRBRCAPATHWAY |
| Enrichment Score (ES) | -0.64102966 |
| Normalized Enrichment Score (NES) | -1.9024193 |
| Nominal p-value | 0.0 |
| FDR q-value | 0.2544335 |
| FWER p-Value | 0.228 |
| PROBE | GENE SYMBOL | GENE_TITLE | RANK IN GENE LIST | RANK METRIC SCORE | RUNNING ES | CORE ENRICHMENT | |
|---|---|---|---|---|---|---|---|
| 1 | RAD17 | 3013 | 1.378 | -0.1219 | No | ||
| 2 | ATM | 3638 | 1.186 | -0.1209 | No | ||
| 3 | FANCC | 4074 | 1.077 | -0.1130 | No | ||
| 4 | CHEK1 | 6785 | 0.522 | -0.2435 | No | ||
| 5 | RAD1 | 8160 | 0.265 | -0.3097 | No | ||
| 6 | FANCA | 8327 | 0.235 | -0.3118 | No | ||
| 7 | HUS1 | 8335 | 0.234 | -0.3053 | No | ||
| 8 | FANCE | 10554 | -0.168 | -0.4197 | No | ||
| 9 | ATR | 10794 | -0.209 | -0.4265 | No | ||
| 10 | FANCD2 | 14086 | -0.890 | -0.5775 | No | ||
| 11 | FANCG | 15268 | -1.211 | -0.6058 | Yes | ||
| 12 | BRCA1 | 15837 | -1.405 | -0.5954 | Yes | ||
| 13 | CHEK2 | 15913 | -1.436 | -0.5577 | Yes | ||
| 14 | BRCA2 | 16426 | -1.645 | -0.5373 | Yes | ||
| 15 | RAD51 | 16891 | -1.889 | -0.5073 | Yes | ||
| 16 | MRE11A | 17211 | -2.133 | -0.4624 | Yes | ||
| 17 | RAD9A | 17496 | -2.372 | -0.4086 | Yes | ||
| 18 | TREX1 | 17668 | -2.565 | -0.3431 | Yes | ||
| 19 | RAD50 | 17930 | -2.875 | -0.2735 | Yes | ||
| 20 | TP53 | 18610 | -10.661 | 0.0003 | Yes |