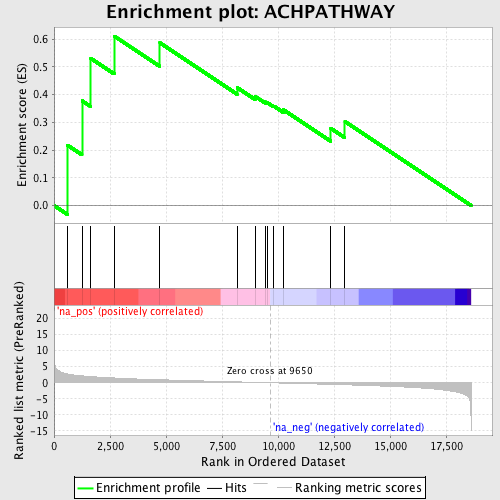
Profile of the Running ES Score & Positions of GeneSet Members on the Rank Ordered List
| Dataset | set04_transDMproB_versus_LMproB |
| Phenotype | NoPhenotypeAvailable |
| Upregulated in class | na_pos |
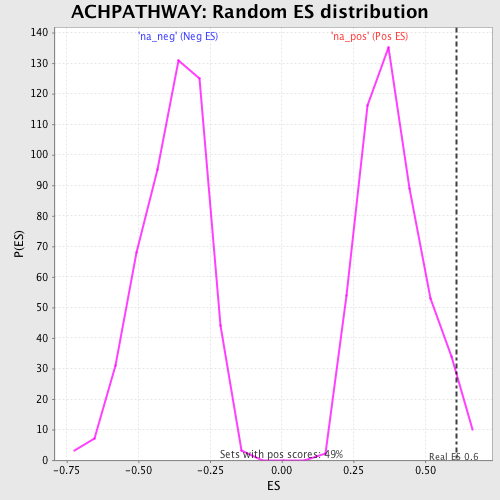
| GeneSet | ACHPATHWAY |
| Enrichment Score (ES) | 0.6109448 |
| Normalized Enrichment Score (NES) | 1.580328 |
| Nominal p-value | 0.026369167 |
| FDR q-value | 0.32812965 |
| FWER p-Value | 0.999 |
| PROBE | GENE SYMBOL | GENE_TITLE | RANK IN GENE LIST | RANK METRIC SCORE | RUNNING ES | CORE ENRICHMENT | |
|---|---|---|---|---|---|---|---|
| 1 | PIK3R1 | 600 | 2.724 | 0.2173 | Yes | ||
| 2 | BAD | 1245 | 2.131 | 0.3779 | Yes | ||
| 3 | YWHAH | 1639 | 1.895 | 0.5305 | Yes | ||
| 4 | PTK2B | 2682 | 1.490 | 0.6109 | Yes | ||
| 5 | RAPSN | 4722 | 0.931 | 0.5867 | No | ||
| 6 | SRC | 8170 | 0.263 | 0.4255 | No | ||
| 7 | CHRNG | 8974 | 0.122 | 0.3935 | No | ||
| 8 | MUSK | 9425 | 0.046 | 0.3736 | No | ||
| 9 | PIK3CA | 9521 | 0.028 | 0.3710 | No | ||
| 10 | TERT | 9808 | -0.031 | 0.3585 | No | ||
| 11 | AKT1 | 10228 | -0.108 | 0.3458 | No | ||
| 12 | PTK2 | 12352 | -0.510 | 0.2784 | No | ||
| 13 | CHRNB1 | 12984 | -0.636 | 0.3027 | No |