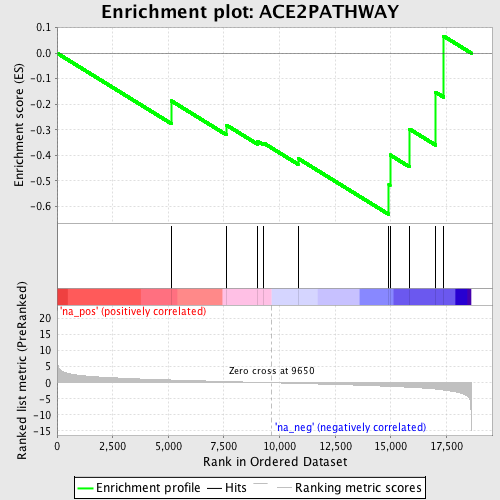
Profile of the Running ES Score & Positions of GeneSet Members on the Rank Ordered List
| Dataset | set04_transDMproB_versus_LMproB |
| Phenotype | NoPhenotypeAvailable |
| Upregulated in class | na_neg |
| GeneSet | ACE2PATHWAY |
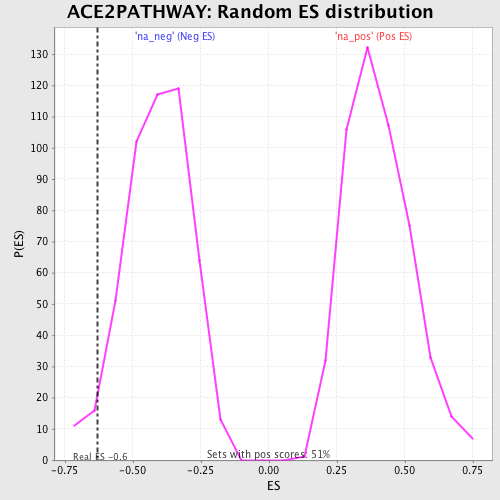
| Enrichment Score (ES) | -0.63146067 |
| Normalized Enrichment Score (NES) | -1.534926 |
| Nominal p-value | 0.040567953 |
| FDR q-value | 0.44438443 |
| FWER p-Value | 0.999 |
| PROBE | GENE SYMBOL | GENE_TITLE | RANK IN GENE LIST | RANK METRIC SCORE | RUNNING ES | CORE ENRICHMENT | |
|---|---|---|---|---|---|---|---|
| 1 | COL4A6 | 5136 | 0.846 | -0.1868 | No | ||
| 2 | COL4A4 | 7612 | 0.364 | -0.2814 | No | ||
| 3 | COL4A2 | 9007 | 0.115 | -0.3442 | No | ||
| 4 | COL4A3 | 9285 | 0.068 | -0.3519 | No | ||
| 5 | AGTR2 | 10833 | -0.217 | -0.4121 | No | ||
| 6 | COL4A5 | 14915 | -1.111 | -0.5143 | Yes | ||
| 7 | COL4A1 | 14965 | -1.125 | -0.3983 | Yes | ||
| 8 | ACE2 | 15843 | -1.406 | -0.2971 | Yes | ||
| 9 | AGTR1 | 17016 | -1.964 | -0.1530 | Yes | ||
| 10 | AGT | 17374 | -2.265 | 0.0667 | Yes |