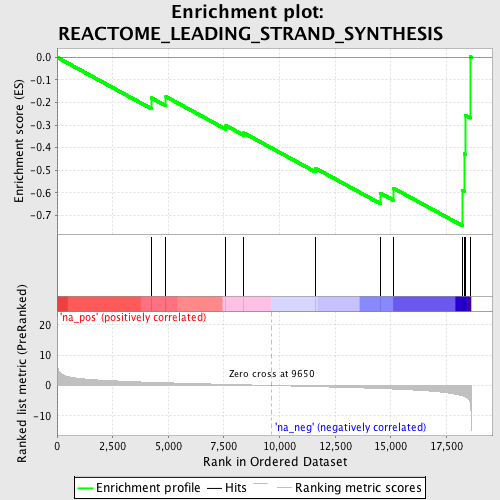
Profile of the Running ES Score & Positions of GeneSet Members on the Rank Ordered List
| Dataset | set04_transDMproB_versus_LMproB |
| Phenotype | NoPhenotypeAvailable |
| Upregulated in class | na_neg |
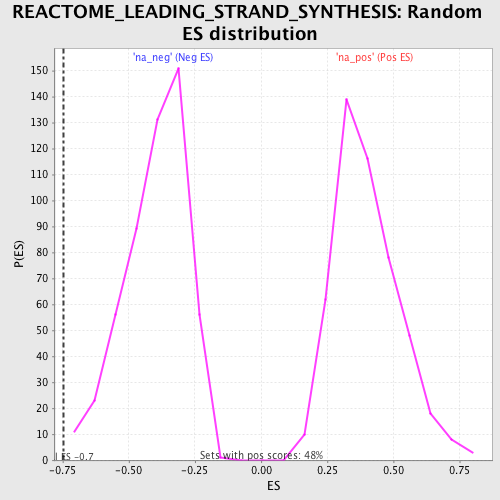
| GeneSet | REACTOME_LEADING_STRAND_SYNTHESIS |
| Enrichment Score (ES) | -0.7467523 |
| Normalized Enrichment Score (NES) | -1.8793151 |
| Nominal p-value | 0.0 |
| FDR q-value | 0.051934637 |
| FWER p-Value | 0.444 |
| PROBE | GENE SYMBOL | GENE_TITLE | RANK IN GENE LIST | RANK METRIC SCORE | RUNNING ES | CORE ENRICHMENT | |
|---|---|---|---|---|---|---|---|
| 1 | PCNA | 4232 | 1.042 | -0.1797 | No | ||
| 2 | RFC4 | 4891 | 0.894 | -0.1740 | No | ||
| 3 | POLA1 | 7588 | 0.368 | -0.3020 | No | ||
| 4 | RFC3 | 8392 | 0.226 | -0.3348 | No | ||
| 5 | PRIM1 | 11609 | -0.365 | -0.4909 | No | ||
| 6 | POLD2 | 14522 | -1.009 | -0.6011 | Yes | ||
| 7 | RFC5 | 15124 | -1.171 | -0.5797 | Yes | ||
| 8 | POLA2 | 18233 | -3.399 | -0.5908 | Yes | ||
| 9 | RFC1 | 18319 | -3.654 | -0.4277 | Yes | ||
| 10 | POLD3 | 18350 | -3.765 | -0.2566 | Yes | ||
| 11 | POLD1 | 18575 | -5.904 | 0.0022 | Yes |