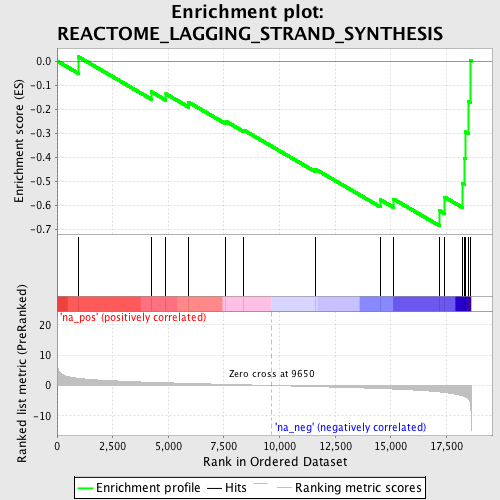
Profile of the Running ES Score & Positions of GeneSet Members on the Rank Ordered List
| Dataset | set04_transDMproB_versus_LMproB |
| Phenotype | NoPhenotypeAvailable |
| Upregulated in class | na_neg |
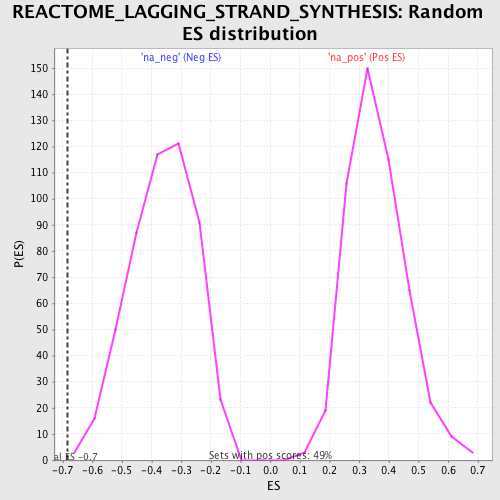
| GeneSet | REACTOME_LAGGING_STRAND_SYNTHESIS |
| Enrichment Score (ES) | -0.68466485 |
| Normalized Enrichment Score (NES) | -1.8949234 |
| Nominal p-value | 0.001968504 |
| FDR q-value | 0.05401166 |
| FWER p-Value | 0.397 |
| PROBE | GENE SYMBOL | GENE_TITLE | RANK IN GENE LIST | RANK METRIC SCORE | RUNNING ES | CORE ENRICHMENT | |
|---|---|---|---|---|---|---|---|
| 1 | RPA3 | 961 | 2.327 | 0.0173 | No | ||
| 2 | PCNA | 4232 | 1.042 | -0.1276 | No | ||
| 3 | RFC4 | 4891 | 0.894 | -0.1365 | No | ||
| 4 | FEN1 | 5919 | 0.680 | -0.1715 | No | ||
| 5 | POLA1 | 7588 | 0.368 | -0.2503 | No | ||
| 6 | RFC3 | 8392 | 0.226 | -0.2868 | No | ||
| 7 | PRIM1 | 11609 | -0.365 | -0.4489 | No | ||
| 8 | POLD2 | 14522 | -1.009 | -0.5755 | No | ||
| 9 | RFC5 | 15124 | -1.171 | -0.5731 | No | ||
| 10 | RPA1 | 17200 | -2.124 | -0.6217 | Yes | ||
| 11 | LIG1 | 17428 | -2.306 | -0.5656 | Yes | ||
| 12 | POLA2 | 18233 | -3.399 | -0.5080 | Yes | ||
| 13 | RFC1 | 18319 | -3.654 | -0.4043 | Yes | ||
| 14 | POLD3 | 18350 | -3.765 | -0.2943 | Yes | ||
| 15 | RPA2 | 18496 | -4.505 | -0.1686 | Yes | ||
| 16 | POLD1 | 18575 | -5.904 | 0.0022 | Yes |