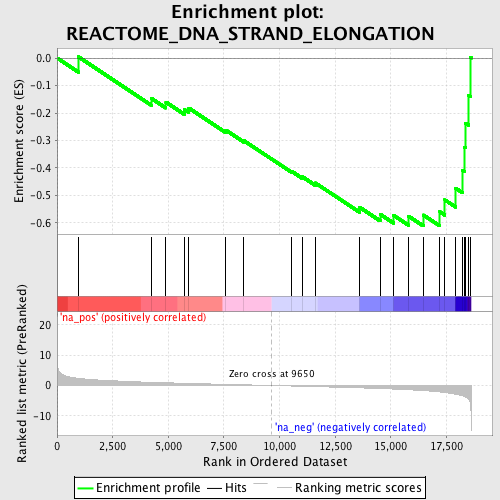
Profile of the Running ES Score & Positions of GeneSet Members on the Rank Ordered List
| Dataset | set04_transDMproB_versus_LMproB |
| Phenotype | NoPhenotypeAvailable |
| Upregulated in class | na_neg |
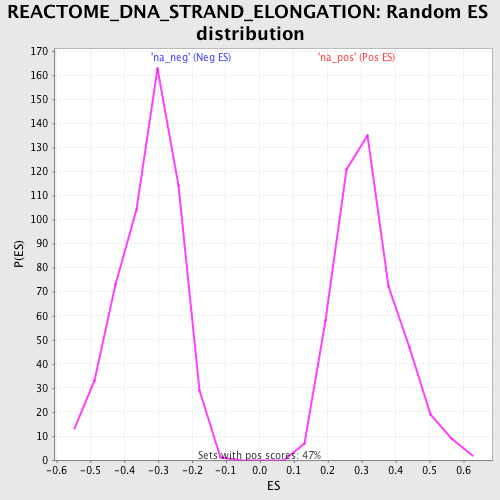
| GeneSet | REACTOME_DNA_STRAND_ELONGATION |
| Enrichment Score (ES) | -0.6109207 |
| Normalized Enrichment Score (NES) | -1.8657475 |
| Nominal p-value | 0.0 |
| FDR q-value | 0.057156954 |
| FWER p-Value | 0.514 |
| PROBE | GENE SYMBOL | GENE_TITLE | RANK IN GENE LIST | RANK METRIC SCORE | RUNNING ES | CORE ENRICHMENT | |
|---|---|---|---|---|---|---|---|
| 1 | RPA3 | 961 | 2.327 | 0.0043 | No | ||
| 2 | PCNA | 4232 | 1.042 | -0.1465 | No | ||
| 3 | RFC4 | 4891 | 0.894 | -0.1603 | No | ||
| 4 | MCM3 | 5720 | 0.721 | -0.1875 | No | ||
| 5 | FEN1 | 5919 | 0.680 | -0.1818 | No | ||
| 6 | POLA1 | 7588 | 0.368 | -0.2626 | No | ||
| 7 | RFC3 | 8392 | 0.226 | -0.3004 | No | ||
| 8 | MCM7 | 10535 | -0.166 | -0.4116 | No | ||
| 9 | MCM2 | 11019 | -0.249 | -0.4316 | No | ||
| 10 | PRIM1 | 11609 | -0.365 | -0.4544 | No | ||
| 11 | MCM4 | 13588 | -0.767 | -0.5424 | No | ||
| 12 | POLD2 | 14522 | -1.009 | -0.5682 | No | ||
| 13 | RFC5 | 15124 | -1.171 | -0.5724 | No | ||
| 14 | CDC45L | 15791 | -1.386 | -0.5748 | Yes | ||
| 15 | MCM6 | 16463 | -1.660 | -0.5710 | Yes | ||
| 16 | RPA1 | 17200 | -2.124 | -0.5594 | Yes | ||
| 17 | LIG1 | 17428 | -2.306 | -0.5161 | Yes | ||
| 18 | MCM5 | 17916 | -2.853 | -0.4736 | Yes | ||
| 19 | POLA2 | 18233 | -3.399 | -0.4088 | Yes | ||
| 20 | RFC1 | 18319 | -3.654 | -0.3254 | Yes | ||
| 21 | POLD3 | 18350 | -3.765 | -0.2364 | Yes | ||
| 22 | RPA2 | 18496 | -4.505 | -0.1357 | Yes | ||
| 23 | POLD1 | 18575 | -5.904 | 0.0022 | Yes |