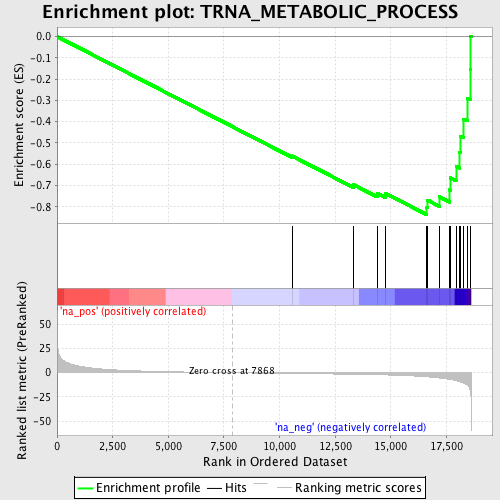
Profile of the Running ES Score & Positions of GeneSet Members on the Rank Ordered List
| Dataset | set04_transDMproB_versus_DMpreB |
| Phenotype | NoPhenotypeAvailable |
| Upregulated in class | na_neg |
| GeneSet | TRNA_METABOLIC_PROCESS |
| Enrichment Score (ES) | -0.8362718 |
| Normalized Enrichment Score (NES) | -2.0717514 |
| Nominal p-value | 0.0 |
| FDR q-value | 0.0 |
| FWER p-Value | 0.0 |
| PROBE | GENE SYMBOL | GENE_TITLE | RANK IN GENE LIST | RANK METRIC SCORE | RUNNING ES | CORE ENRICHMENT | |
|---|---|---|---|---|---|---|---|
| 1 | SSB | 10562 | -0.784 | -0.5613 | No | ||
| 2 | YARS | 13320 | -1.622 | -0.6961 | No | ||
| 3 | FARS2 | 14395 | -2.087 | -0.7366 | No | ||
| 4 | POP4 | 14770 | -2.291 | -0.7377 | No | ||
| 5 | SARS2 | 16604 | -4.176 | -0.8017 | Yes | ||
| 6 | WARS | 16637 | -4.225 | -0.7685 | Yes | ||
| 7 | SCYE1 | 17183 | -5.432 | -0.7528 | Yes | ||
| 8 | KARS | 17650 | -6.884 | -0.7209 | Yes | ||
| 9 | ADAT1 | 17675 | -7.012 | -0.6641 | Yes | ||
| 10 | NSUN2 | 17934 | -8.142 | -0.6106 | Yes | ||
| 11 | POP1 | 18075 | -9.018 | -0.5435 | Yes | ||
| 12 | AARS | 18136 | -9.503 | -0.4681 | Yes | ||
| 13 | DARS | 18271 | -10.578 | -0.3877 | Yes | ||
| 14 | METTL1 | 18441 | -12.803 | -0.2908 | Yes | ||
| 15 | RARS | 18565 | -17.404 | -0.1534 | Yes | ||
| 16 | TRNT1 | 18578 | -18.858 | 0.0020 | Yes |