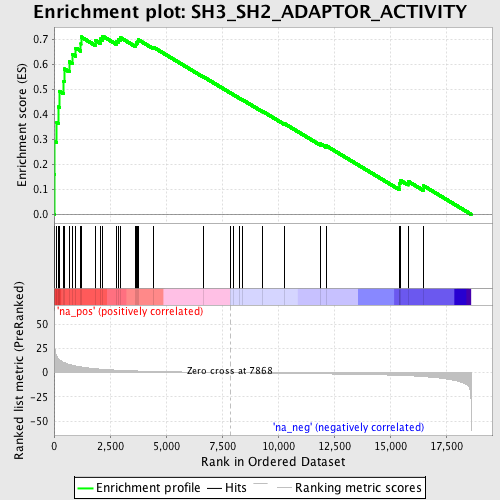
Profile of the Running ES Score & Positions of GeneSet Members on the Rank Ordered List
| Dataset | set04_transDMproB_versus_DMpreB |
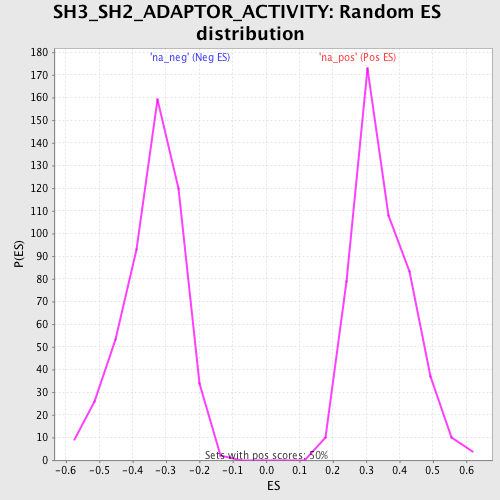
| Phenotype | NoPhenotypeAvailable |
| Upregulated in class | na_pos |
| GeneSet | SH3_SH2_ADAPTOR_ACTIVITY |
| Enrichment Score (ES) | 0.71275187 |
| Normalized Enrichment Score (NES) | 2.0541728 |
| Nominal p-value | 0.0 |
| FDR q-value | 0.007390905 |
| FWER p-Value | 0.0070 |
| PROBE | GENE SYMBOL | GENE_TITLE | RANK IN GENE LIST | RANK METRIC SCORE | RUNNING ES | CORE ENRICHMENT | |
|---|---|---|---|---|---|---|---|
| 1 | VAV3 | 11 | 33.496 | 0.1608 | Yes | ||
| 2 | GAB1 | 24 | 27.320 | 0.2917 | Yes | ||
| 3 | GRB7 | 120 | 16.803 | 0.3675 | Yes | ||
| 4 | LASP1 | 206 | 13.841 | 0.4296 | Yes | ||
| 5 | BLNK | 239 | 13.319 | 0.4921 | Yes | ||
| 6 | LAT | 432 | 10.644 | 0.5330 | Yes | ||
| 7 | SOCS2 | 459 | 10.367 | 0.5815 | Yes | ||
| 8 | SH3BP2 | 676 | 8.459 | 0.6107 | Yes | ||
| 9 | SH2D2A | 813 | 7.647 | 0.6402 | Yes | ||
| 10 | ARHGAP4 | 967 | 6.888 | 0.6651 | Yes | ||
| 11 | SH3BGRL | 1197 | 5.931 | 0.6813 | Yes | ||
| 12 | STAM | 1201 | 5.908 | 0.7096 | Yes | ||
| 13 | SHB | 1838 | 4.155 | 0.6954 | Yes | ||
| 14 | SH2D3C | 2058 | 3.709 | 0.7015 | Yes | ||
| 15 | GRB2 | 2166 | 3.530 | 0.7128 | Yes | ||
| 16 | ARHGAP6 | 2790 | 2.639 | 0.6919 | No | ||
| 17 | CRKL | 2883 | 2.519 | 0.6991 | No | ||
| 18 | CHN2 | 2957 | 2.437 | 0.7069 | No | ||
| 19 | ITSN2 | 3654 | 1.812 | 0.6782 | No | ||
| 20 | GRAP2 | 3668 | 1.800 | 0.6862 | No | ||
| 21 | ABI2 | 3739 | 1.755 | 0.6908 | No | ||
| 22 | IRS4 | 3765 | 1.736 | 0.6979 | No | ||
| 23 | GRB14 | 4423 | 1.337 | 0.6689 | No | ||
| 24 | CHN1 | 6662 | 0.378 | 0.5503 | No | ||
| 25 | SNX9 | 7873 | -0.001 | 0.4852 | No | ||
| 26 | SKAP2 | 8006 | -0.044 | 0.4783 | No | ||
| 27 | SLA | 8271 | -0.125 | 0.4647 | No | ||
| 28 | SH3BGR | 8406 | -0.164 | 0.4583 | No | ||
| 29 | RUSC1 | 9318 | -0.434 | 0.4113 | No | ||
| 30 | GRAP | 10268 | -0.699 | 0.3636 | No | ||
| 31 | GRB10 | 11883 | -1.163 | 0.2823 | No | ||
| 32 | SRC | 12150 | -1.245 | 0.2740 | No | ||
| 33 | ARHGAP1 | 15417 | -2.732 | 0.1114 | No | ||
| 34 | KHDRBS1 | 15419 | -2.733 | 0.1245 | No | ||
| 35 | CNTNAP1 | 15448 | -2.754 | 0.1363 | No | ||
| 36 | TOB1 | 15802 | -3.090 | 0.1322 | No | ||
| 37 | EPS8 | 16493 | -3.994 | 0.1143 | No |