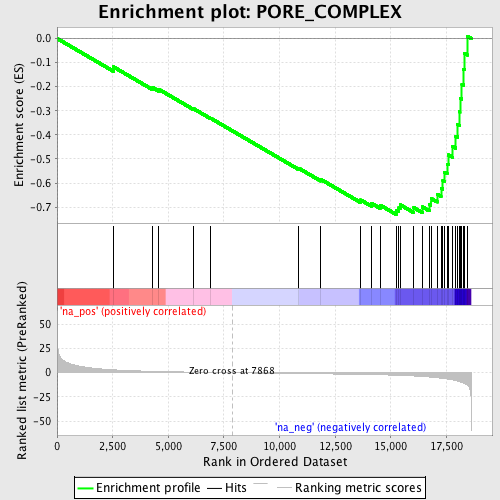
Profile of the Running ES Score & Positions of GeneSet Members on the Rank Ordered List
| Dataset | set04_transDMproB_versus_DMpreB |
| Phenotype | NoPhenotypeAvailable |
| Upregulated in class | na_neg |
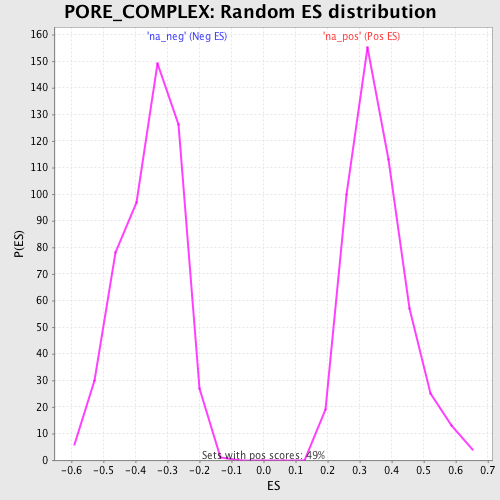
| GeneSet | PORE_COMPLEX |
| Enrichment Score (ES) | -0.7303662 |
| Normalized Enrichment Score (NES) | -2.0635226 |
| Nominal p-value | 0.0 |
| FDR q-value | 4.8411115E-5 |
| FWER p-Value | 0.0010 |
| PROBE | GENE SYMBOL | GENE_TITLE | RANK IN GENE LIST | RANK METRIC SCORE | RUNNING ES | CORE ENRICHMENT | |
|---|---|---|---|---|---|---|---|
| 1 | SENP2 | 2529 | 2.972 | -0.1176 | No | ||
| 2 | TPR | 4303 | 1.407 | -0.2043 | No | ||
| 3 | NUP153 | 4572 | 1.239 | -0.2110 | No | ||
| 4 | C8A | 6123 | 0.573 | -0.2908 | No | ||
| 5 | VDAC1 | 6909 | 0.294 | -0.3312 | No | ||
| 6 | BAK1 | 10863 | -0.868 | -0.5385 | No | ||
| 7 | IPO7 | 11849 | -1.155 | -0.5844 | No | ||
| 8 | NUP62 | 13644 | -1.743 | -0.6700 | No | ||
| 9 | NUP98 | 14125 | -1.955 | -0.6837 | No | ||
| 10 | KPNA3 | 14520 | -2.158 | -0.6915 | No | ||
| 11 | HRB | 15243 | -2.597 | -0.7142 | Yes | ||
| 12 | RANBP2 | 15351 | -2.683 | -0.7033 | Yes | ||
| 13 | KPNA1 | 15426 | -2.738 | -0.6903 | Yes | ||
| 14 | RANGAP1 | 16032 | -3.337 | -0.7021 | Yes | ||
| 15 | NUTF2 | 16418 | -3.866 | -0.6988 | Yes | ||
| 16 | NXT1 | 16735 | -4.425 | -0.6883 | Yes | ||
| 17 | SUMO1 | 16805 | -4.573 | -0.6636 | Yes | ||
| 18 | NUP88 | 17086 | -5.151 | -0.6466 | Yes | ||
| 19 | XPO7 | 17259 | -5.617 | -0.6210 | Yes | ||
| 20 | AAAS | 17340 | -5.826 | -0.5891 | Yes | ||
| 21 | DDX19B | 17404 | -6.015 | -0.5551 | Yes | ||
| 22 | KPNB1 | 17532 | -6.478 | -0.5216 | Yes | ||
| 23 | NUP160 | 17587 | -6.659 | -0.4832 | Yes | ||
| 24 | NUP133 | 17763 | -7.351 | -0.4469 | Yes | ||
| 25 | NUP54 | 17920 | -8.056 | -0.4052 | Yes | ||
| 26 | NUP107 | 18002 | -8.549 | -0.3564 | Yes | ||
| 27 | NUP50 | 18095 | -9.166 | -0.3044 | Yes | ||
| 28 | EIF5A | 18110 | -9.263 | -0.2476 | Yes | ||
| 29 | RAE1 | 18196 | -9.988 | -0.1901 | Yes | ||
| 30 | SNUPN | 18262 | -10.525 | -0.1282 | Yes | ||
| 31 | RANBP5 | 18309 | -11.017 | -0.0622 | Yes | ||
| 32 | BAX | 18434 | -12.657 | 0.0098 | Yes |