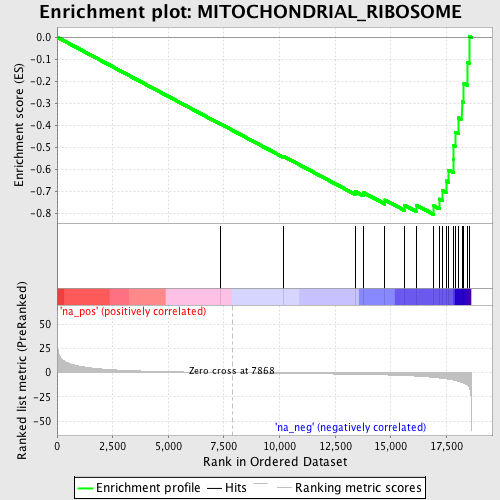
Profile of the Running ES Score & Positions of GeneSet Members on the Rank Ordered List
| Dataset | set04_transDMproB_versus_DMpreB |
| Phenotype | NoPhenotypeAvailable |
| Upregulated in class | na_neg |
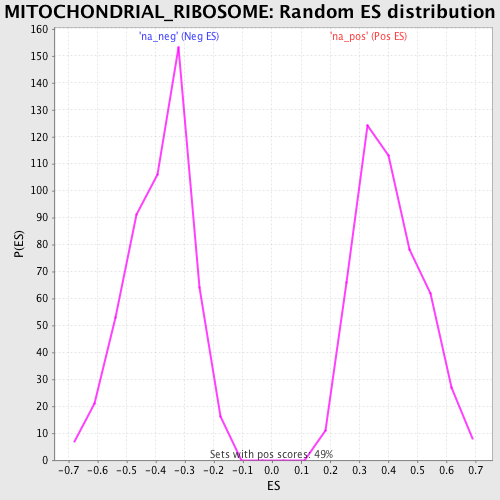
| GeneSet | MITOCHONDRIAL_RIBOSOME |
| Enrichment Score (ES) | -0.80450773 |
| Normalized Enrichment Score (NES) | -2.0779154 |
| Nominal p-value | 0.0 |
| FDR q-value | 0.0 |
| FWER p-Value | 0.0 |
| PROBE | GENE SYMBOL | GENE_TITLE | RANK IN GENE LIST | RANK METRIC SCORE | RUNNING ES | CORE ENRICHMENT | |
|---|---|---|---|---|---|---|---|
| 1 | MRPS22 | 7329 | 0.158 | -0.3928 | No | ||
| 2 | MRPS36 | 10158 | -0.671 | -0.5394 | No | ||
| 3 | MRPS16 | 13405 | -1.653 | -0.7004 | No | ||
| 4 | MRPL51 | 13767 | -1.797 | -0.7052 | No | ||
| 5 | MRPS18C | 14737 | -2.270 | -0.7387 | No | ||
| 6 | MRPS21 | 15611 | -2.886 | -0.7621 | No | ||
| 7 | MRPL52 | 16151 | -3.474 | -0.7627 | No | ||
| 8 | MRPS15 | 16929 | -4.811 | -0.7652 | Yes | ||
| 9 | MRPL23 | 17176 | -5.414 | -0.7342 | Yes | ||
| 10 | MRPL55 | 17319 | -5.752 | -0.6949 | Yes | ||
| 11 | MRPS28 | 17486 | -6.297 | -0.6524 | Yes | ||
| 12 | MRPS12 | 17597 | -6.703 | -0.6036 | Yes | ||
| 13 | MRPS18A | 17816 | -7.611 | -0.5531 | Yes | ||
| 14 | MRPS11 | 17822 | -7.639 | -0.4910 | Yes | ||
| 15 | MRPL40 | 17906 | -7.977 | -0.4304 | Yes | ||
| 16 | MRPL10 | 18029 | -8.693 | -0.3659 | Yes | ||
| 17 | MRPS24 | 18199 | -10.028 | -0.2931 | Yes | ||
| 18 | MRPS35 | 18286 | -10.769 | -0.2098 | Yes | ||
| 19 | MRPL12 | 18440 | -12.794 | -0.1135 | Yes | ||
| 20 | MRPS10 | 18528 | -15.055 | 0.0047 | Yes |