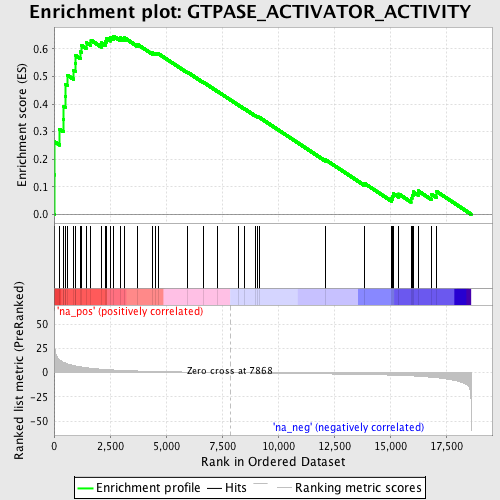
Profile of the Running ES Score & Positions of GeneSet Members on the Rank Ordered List
| Dataset | set04_transDMproB_versus_DMpreB |
| Phenotype | NoPhenotypeAvailable |
| Upregulated in class | na_pos |
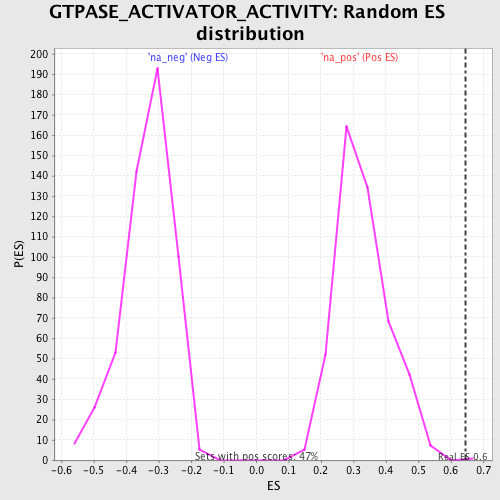
| GeneSet | GTPASE_ACTIVATOR_ACTIVITY |
| Enrichment Score (ES) | 0.64663976 |
| Normalized Enrichment Score (NES) | 1.9610263 |
| Nominal p-value | 0.0021141649 |
| FDR q-value | 0.0196554 |
| FWER p-Value | 0.089 |
| PROBE | GENE SYMBOL | GENE_TITLE | RANK IN GENE LIST | RANK METRIC SCORE | RUNNING ES | CORE ENRICHMENT | |
|---|---|---|---|---|---|---|---|
| 1 | VAV3 | 11 | 33.496 | 0.1430 | Yes | ||
| 2 | ABR | 21 | 28.176 | 0.2633 | Yes | ||
| 3 | THY1 | 245 | 13.250 | 0.3081 | Yes | ||
| 4 | ARFGAP3 | 410 | 10.819 | 0.3456 | Yes | ||
| 5 | RASA3 | 433 | 10.636 | 0.3900 | Yes | ||
| 6 | SIPA1 | 501 | 9.928 | 0.4289 | Yes | ||
| 7 | BCR | 517 | 9.784 | 0.4701 | Yes | ||
| 8 | RALBP1 | 597 | 9.033 | 0.5045 | Yes | ||
| 9 | RASA4 | 868 | 7.374 | 0.5216 | Yes | ||
| 10 | RGS12 | 950 | 6.962 | 0.5471 | Yes | ||
| 11 | ARHGAP4 | 967 | 6.888 | 0.5757 | Yes | ||
| 12 | CDC42EP2 | 1188 | 5.960 | 0.5894 | Yes | ||
| 13 | MYO9B | 1213 | 5.867 | 0.6133 | Yes | ||
| 14 | RASA1 | 1431 | 5.144 | 0.6237 | Yes | ||
| 15 | ARHGAP10 | 1645 | 4.583 | 0.6318 | Yes | ||
| 16 | RGS1 | 2112 | 3.615 | 0.6222 | Yes | ||
| 17 | OPHN1 | 2283 | 3.333 | 0.6274 | Yes | ||
| 18 | RGS2 | 2330 | 3.259 | 0.6389 | Yes | ||
| 19 | RABGAP1 | 2518 | 2.986 | 0.6416 | Yes | ||
| 20 | CENTD2 | 2648 | 2.799 | 0.6466 | Yes | ||
| 21 | CHN2 | 2957 | 2.437 | 0.6405 | No | ||
| 22 | NF1 | 3132 | 2.270 | 0.6409 | No | ||
| 23 | RGS9 | 3741 | 1.754 | 0.6156 | No | ||
| 24 | RGS6 | 4393 | 1.353 | 0.5864 | No | ||
| 25 | RASA2 | 4517 | 1.270 | 0.5852 | No | ||
| 26 | SOS1 | 4644 | 1.201 | 0.5836 | No | ||
| 27 | TSC2 | 5954 | 0.645 | 0.5158 | No | ||
| 28 | RGS11 | 6673 | 0.375 | 0.4788 | No | ||
| 29 | ARFGEF1 | 7308 | 0.166 | 0.4454 | No | ||
| 30 | DEPDC2 | 8242 | -0.116 | 0.3956 | No | ||
| 31 | RASGRP3 | 8508 | -0.196 | 0.3822 | No | ||
| 32 | ALDH1A1 | 8973 | -0.335 | 0.3586 | No | ||
| 33 | GMIP | 9085 | -0.366 | 0.3542 | No | ||
| 34 | RGS14 | 9172 | -0.391 | 0.3513 | No | ||
| 35 | RACGAP1 | 12113 | -1.234 | 0.1983 | No | ||
| 36 | ARHGAP5 | 13857 | -1.836 | 0.1123 | No | ||
| 37 | DLC1 | 15061 | -2.463 | 0.0581 | No | ||
| 38 | DOCK4 | 15119 | -2.509 | 0.0657 | No | ||
| 39 | RGS20 | 15136 | -2.521 | 0.0757 | No | ||
| 40 | RGS4 | 15388 | -2.709 | 0.0738 | No | ||
| 41 | BNIP2 | 15933 | -3.231 | 0.0583 | No | ||
| 42 | RASAL1 | 15979 | -3.275 | 0.0699 | No | ||
| 43 | RANGAP1 | 16032 | -3.337 | 0.0814 | No | ||
| 44 | RGS3 | 16253 | -3.614 | 0.0851 | No | ||
| 45 | CENTA1 | 16847 | -4.663 | 0.0731 | No | ||
| 46 | RGS16 | 17080 | -5.145 | 0.0827 | No |