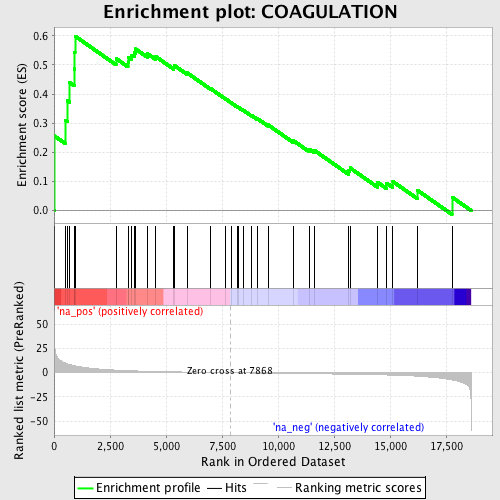
Profile of the Running ES Score & Positions of GeneSet Members on the Rank Ordered List
| Dataset | set04_transDMproB_versus_DMpreB |
| Phenotype | NoPhenotypeAvailable |
| Upregulated in class | na_pos |
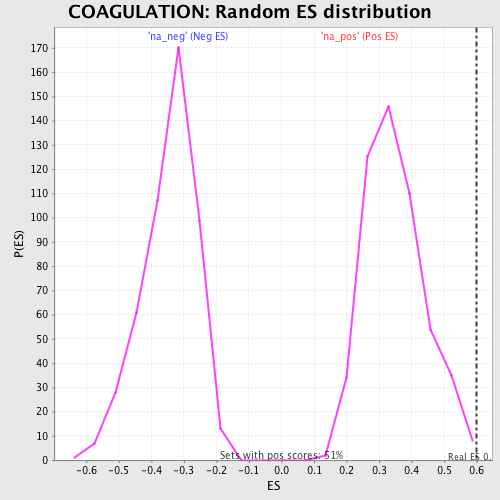
| GeneSet | COAGULATION |
| Enrichment Score (ES) | 0.59907687 |
| Normalized Enrichment Score (NES) | 1.7165457 |
| Nominal p-value | 0.0058365758 |
| FDR q-value | 0.18033375 |
| FWER p-Value | 0.968 |
| PROBE | GENE SYMBOL | GENE_TITLE | RANK IN GENE LIST | RANK METRIC SCORE | RUNNING ES | CORE ENRICHMENT | |
|---|---|---|---|---|---|---|---|
| 1 | MMRN1 | 12 | 31.854 | 0.2564 | Yes | ||
| 2 | PROS1 | 515 | 9.789 | 0.3084 | Yes | ||
| 3 | F9 | 594 | 9.052 | 0.3772 | Yes | ||
| 4 | F2RL3 | 698 | 8.334 | 0.4389 | Yes | ||
| 5 | F8 | 895 | 7.206 | 0.4865 | Yes | ||
| 6 | GNAQ | 918 | 7.135 | 0.5429 | Yes | ||
| 7 | WAS | 934 | 7.059 | 0.5991 | Yes | ||
| 8 | ADORA2A | 2767 | 2.664 | 0.5220 | No | ||
| 9 | GNA12 | 3300 | 2.106 | 0.5103 | No | ||
| 10 | F12 | 3319 | 2.091 | 0.5262 | No | ||
| 11 | GP9 | 3468 | 1.956 | 0.5341 | No | ||
| 12 | GGCX | 3593 | 1.866 | 0.5424 | No | ||
| 13 | F5 | 3633 | 1.828 | 0.5551 | No | ||
| 14 | F10 | 4163 | 1.495 | 0.5387 | No | ||
| 15 | F2 | 4543 | 1.254 | 0.5284 | No | ||
| 16 | F7 | 5342 | 0.880 | 0.4926 | No | ||
| 17 | TMPRSS6 | 5368 | 0.869 | 0.4982 | No | ||
| 18 | PF4 | 5939 | 0.652 | 0.4728 | No | ||
| 19 | F2RL2 | 6984 | 0.273 | 0.4188 | No | ||
| 20 | SERPINE1 | 7642 | 0.068 | 0.3840 | No | ||
| 21 | PLAT | 7901 | -0.010 | 0.3702 | No | ||
| 22 | PROC | 8185 | -0.098 | 0.3558 | No | ||
| 23 | HNF4A | 8236 | -0.114 | 0.3540 | No | ||
| 24 | VWF | 8456 | -0.179 | 0.3436 | No | ||
| 25 | THBD | 8812 | -0.293 | 0.3269 | No | ||
| 26 | CD40LG | 9073 | -0.363 | 0.3158 | No | ||
| 27 | GP1BA | 9552 | -0.501 | 0.2941 | No | ||
| 28 | ENTPD1 | 10687 | -0.821 | 0.2397 | No | ||
| 29 | KNG1 | 11393 | -1.016 | 0.2100 | No | ||
| 30 | F13B | 11613 | -1.077 | 0.2069 | No | ||
| 31 | PLG | 13145 | -1.557 | 0.1371 | No | ||
| 32 | F2R | 13208 | -1.578 | 0.1465 | No | ||
| 33 | CD36 | 14432 | -2.105 | 0.0976 | No | ||
| 34 | LMAN1 | 14843 | -2.333 | 0.0944 | No | ||
| 35 | ITGB3 | 15124 | -2.511 | 0.0996 | No | ||
| 36 | TFPI | 16227 | -3.586 | 0.0692 | No | ||
| 37 | PABPC4 | 17764 | -7.353 | 0.0459 | No |