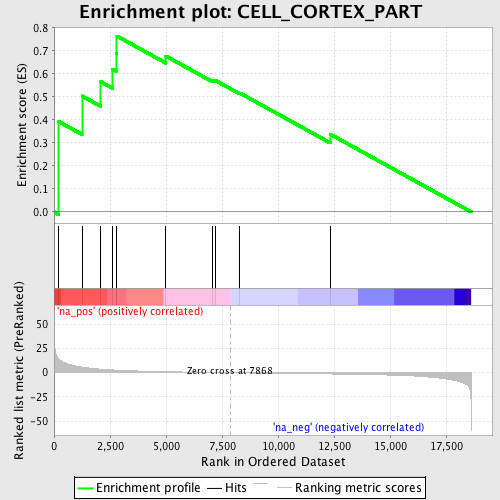
Profile of the Running ES Score & Positions of GeneSet Members on the Rank Ordered List
| Dataset | set04_transDMproB_versus_DMpreB |
| Phenotype | NoPhenotypeAvailable |
| Upregulated in class | na_pos |
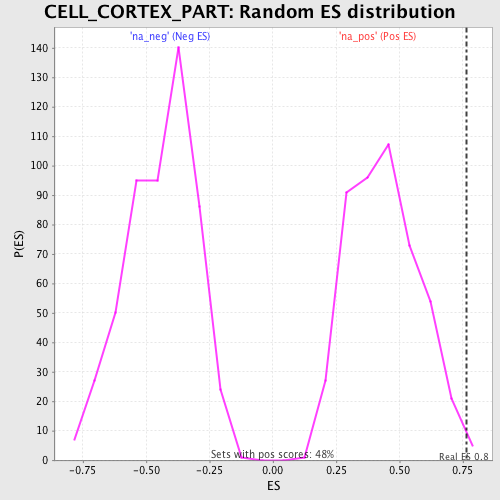
| GeneSet | CELL_CORTEX_PART |
| Enrichment Score (ES) | 0.7646174 |
| Normalized Enrichment Score (NES) | 1.7437334 |
| Nominal p-value | 0.002105263 |
| FDR q-value | 0.17624748 |
| FWER p-Value | 0.915 |
| PROBE | GENE SYMBOL | GENE_TITLE | RANK IN GENE LIST | RANK METRIC SCORE | RUNNING ES | CORE ENRICHMENT | |
|---|---|---|---|---|---|---|---|
| 1 | LASP1 | 206 | 13.841 | 0.3928 | Yes | ||
| 2 | ANLN | 1246 | 5.735 | 0.5043 | Yes | ||
| 3 | MYH9 | 2087 | 3.658 | 0.5659 | Yes | ||
| 4 | CLASP1 | 2610 | 2.849 | 0.6210 | Yes | ||
| 5 | SLC4A1 | 2768 | 2.660 | 0.6902 | Yes | ||
| 6 | MAPRE1 | 2806 | 2.619 | 0.7646 | Yes | ||
| 7 | TRPC4 | 4988 | 1.043 | 0.6778 | No | ||
| 8 | SPTBN4 | 7075 | 0.239 | 0.5727 | No | ||
| 9 | GYPC | 7205 | 0.199 | 0.5716 | No | ||
| 10 | PRKCI | 8291 | -0.129 | 0.5170 | No | ||
| 11 | GYS2 | 12332 | -1.297 | 0.3377 | No |