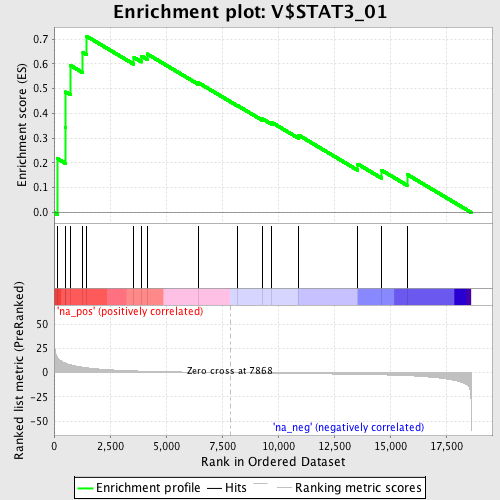
Profile of the Running ES Score & Positions of GeneSet Members on the Rank Ordered List
| Dataset | set04_transDMproB_versus_DMpreB |
| Phenotype | NoPhenotypeAvailable |
| Upregulated in class | na_pos |
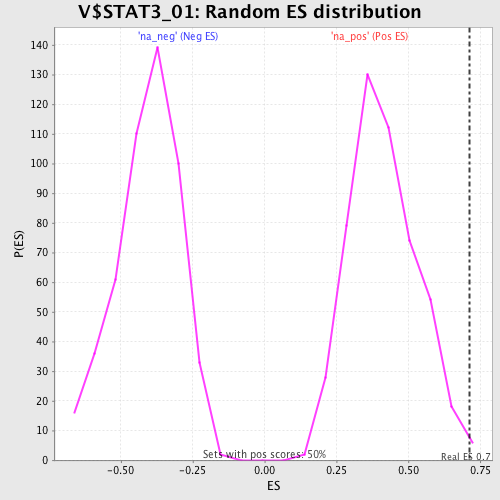
| GeneSet | V$STAT3_01 |
| Enrichment Score (ES) | 0.7118596 |
| Normalized Enrichment Score (NES) | 1.7220165 |
| Nominal p-value | 0.005964215 |
| FDR q-value | 0.040936135 |
| FWER p-Value | 0.369 |
| PROBE | GENE SYMBOL | GENE_TITLE | RANK IN GENE LIST | RANK METRIC SCORE | RUNNING ES | CORE ENRICHMENT | |
|---|---|---|---|---|---|---|---|
| 1 | CISH | 151 | 15.397 | 0.2172 | Yes | ||
| 2 | IRF1 | 500 | 9.935 | 0.3439 | Yes | ||
| 3 | PROS1 | 515 | 9.789 | 0.4864 | Yes | ||
| 4 | TRAF4 | 740 | 8.116 | 0.5932 | Yes | ||
| 5 | ICAM1 | 1285 | 5.589 | 0.6457 | Yes | ||
| 6 | ELMO1 | 1445 | 5.102 | 0.7119 | Yes | ||
| 7 | SERPING1 | 3564 | 1.893 | 0.6257 | No | ||
| 8 | SLC38A5 | 3906 | 1.633 | 0.6313 | No | ||
| 9 | CCL2 | 4155 | 1.500 | 0.6399 | No | ||
| 10 | UBR1 | 6428 | 0.462 | 0.5245 | No | ||
| 11 | APBA1 | 8194 | -0.101 | 0.4311 | No | ||
| 12 | BTBD1 | 9308 | -0.431 | 0.3775 | No | ||
| 13 | ZNF228 | 9706 | -0.546 | 0.3642 | No | ||
| 14 | VIP | 10924 | -0.884 | 0.3117 | No | ||
| 15 | CLDN5 | 13552 | -1.715 | 0.1956 | No | ||
| 16 | MAFF | 14629 | -2.209 | 0.1700 | No | ||
| 17 | HNRPR | 15758 | -3.024 | 0.1537 | No |