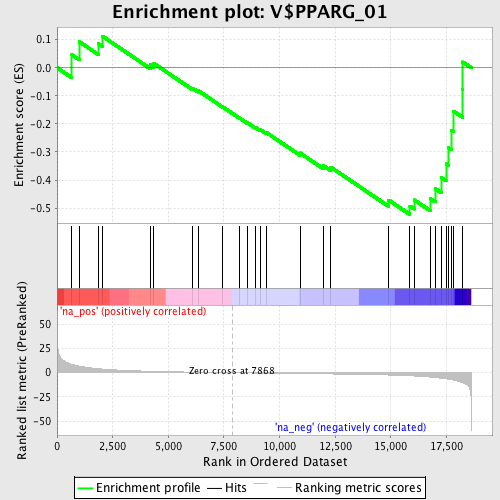
Profile of the Running ES Score & Positions of GeneSet Members on the Rank Ordered List
| Dataset | set04_transDMproB_versus_DMpreB |
| Phenotype | NoPhenotypeAvailable |
| Upregulated in class | na_neg |
| GeneSet | V$PPARG_01 |
| Enrichment Score (ES) | -0.5226822 |
| Normalized Enrichment Score (NES) | -1.4358644 |
| Nominal p-value | 0.0554371 |
| FDR q-value | 0.25316614 |
| FWER p-Value | 0.999 |
| PROBE | GENE SYMBOL | GENE_TITLE | RANK IN GENE LIST | RANK METRIC SCORE | RUNNING ES | CORE ENRICHMENT | |
|---|---|---|---|---|---|---|---|
| 1 | PPARGC1A | 665 | 8.507 | 0.0458 | No | ||
| 2 | PAK4 | 998 | 6.757 | 0.0927 | No | ||
| 3 | HSD17B8 | 1868 | 4.103 | 0.0853 | No | ||
| 4 | ESRRA | 2031 | 3.765 | 0.1126 | No | ||
| 5 | ZSWIM3 | 4193 | 1.474 | 0.0105 | No | ||
| 6 | AP1B1 | 4350 | 1.379 | 0.0153 | No | ||
| 7 | GPR124 | 6083 | 0.587 | -0.0722 | No | ||
| 8 | RPL27 | 6352 | 0.486 | -0.0820 | No | ||
| 9 | NR2C1 | 7443 | 0.128 | -0.1394 | No | ||
| 10 | ZIC4 | 8203 | -0.102 | -0.1792 | No | ||
| 11 | APOM | 8541 | -0.205 | -0.1954 | No | ||
| 12 | NDUFS1 | 8907 | -0.316 | -0.2120 | No | ||
| 13 | AGPS | 9140 | -0.381 | -0.2208 | No | ||
| 14 | GOLGA4 | 9403 | -0.458 | -0.2306 | No | ||
| 15 | SYT6 | 10917 | -0.882 | -0.3035 | No | ||
| 16 | PAX7 | 11973 | -1.192 | -0.3488 | No | ||
| 17 | CNTFR | 12298 | -1.286 | -0.3539 | No | ||
| 18 | PRRX2 | 14904 | -2.363 | -0.4714 | No | ||
| 19 | GRPEL1 | 15858 | -3.147 | -0.4925 | Yes | ||
| 20 | SNRPF | 16058 | -3.366 | -0.4710 | Yes | ||
| 21 | SFRS6 | 16781 | -4.534 | -0.4663 | Yes | ||
| 22 | RQCD1 | 17000 | -4.938 | -0.4307 | Yes | ||
| 23 | USP37 | 17264 | -5.627 | -0.3909 | Yes | ||
| 24 | MRPS28 | 17486 | -6.297 | -0.3425 | Yes | ||
| 25 | EEF1B2 | 17575 | -6.609 | -0.2838 | Yes | ||
| 26 | DNAJA2 | 17734 | -7.231 | -0.2230 | Yes | ||
| 27 | SMYD5 | 17825 | -7.642 | -0.1546 | Yes | ||
| 28 | NR2F6 | 18225 | -10.223 | -0.0781 | Yes | ||
| 29 | MAGMAS | 18234 | -10.335 | 0.0206 | Yes |
