Profile of the Running ES Score & Positions of GeneSet Members on the Rank Ordered List
| Dataset | set04_transDMproB_versus_DMpreB |
| Phenotype | NoPhenotypeAvailable |
| Upregulated in class | na_neg |
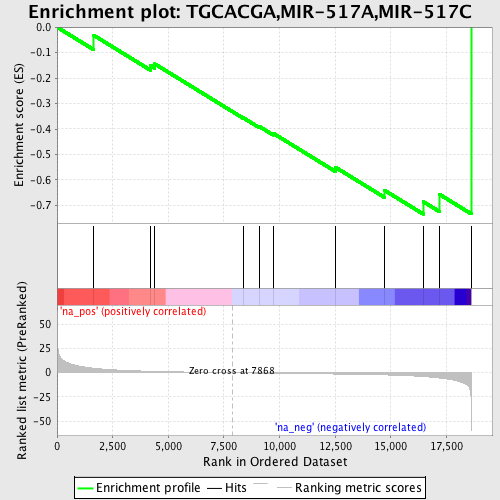
| GeneSet | TGCACGA,MIR-517A,MIR-517C |
| Enrichment Score (ES) | -0.73422235 |
| Normalized Enrichment Score (NES) | -1.6129134 |
| Nominal p-value | 0.01992032 |
| FDR q-value | 0.062108275 |
| FWER p-Value | 0.646 |
| PROBE | GENE SYMBOL | GENE_TITLE | RANK IN GENE LIST | RANK METRIC SCORE | RUNNING ES | CORE ENRICHMENT | |
|---|---|---|---|---|---|---|---|
| 1 | PTK2B | 1651 | 4.557 | -0.0321 | No | ||
| 2 | DBN1 | 4212 | 1.461 | -0.1515 | No | ||
| 3 | NPAS4 | 4391 | 1.354 | -0.1442 | No | ||
| 4 | CBLN2 | 8355 | -0.149 | -0.3554 | No | ||
| 5 | SFRS1 | 9103 | -0.371 | -0.3909 | No | ||
| 6 | BSN | 9715 | -0.547 | -0.4170 | No | ||
| 7 | PHF13 | 12505 | -1.351 | -0.5501 | No | ||
| 8 | HNRPU | 14707 | -2.254 | -0.6403 | No | ||
| 9 | AMMECR1 | 16455 | -3.927 | -0.6854 | Yes | ||
| 10 | ACACA | 17197 | -5.459 | -0.6573 | Yes | ||
| 11 | CDKN2A | 18616 | -58.998 | -0.0000 | Yes |
