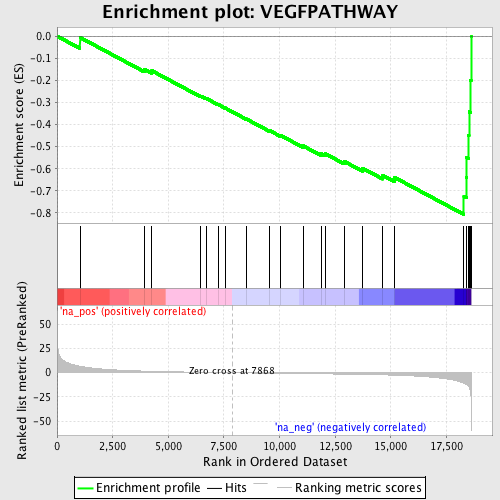
Profile of the Running ES Score & Positions of GeneSet Members on the Rank Ordered List
| Dataset | set04_transDMproB_versus_DMpreB |
| Phenotype | NoPhenotypeAvailable |
| Upregulated in class | na_neg |
| GeneSet | VEGFPATHWAY |
| Enrichment Score (ES) | -0.8068959 |
| Normalized Enrichment Score (NES) | -2.1792953 |
| Nominal p-value | 0.0 |
| FDR q-value | 0.0 |
| FWER p-Value | 0.0 |
| PROBE | GENE SYMBOL | GENE_TITLE | RANK IN GENE LIST | RANK METRIC SCORE | RUNNING ES | CORE ENRICHMENT | |
|---|---|---|---|---|---|---|---|
| 1 | PRKCB1 | 1028 | 6.604 | -0.0057 | No | ||
| 2 | PXN | 3929 | 1.619 | -0.1495 | No | ||
| 3 | PIK3R1 | 4260 | 1.432 | -0.1565 | No | ||
| 4 | ELAVL1 | 6456 | 0.450 | -0.2711 | No | ||
| 5 | HIF1A | 6695 | 0.367 | -0.2812 | No | ||
| 6 | PLCG1 | 7237 | 0.186 | -0.3089 | No | ||
| 7 | PIK3CA | 7547 | 0.100 | -0.3247 | No | ||
| 8 | PRKCA | 8501 | -0.195 | -0.3745 | No | ||
| 9 | EIF2B2 | 9524 | -0.492 | -0.4258 | No | ||
| 10 | KDR | 10022 | -0.636 | -0.4477 | No | ||
| 11 | NOS3 | 11056 | -0.918 | -0.4964 | No | ||
| 12 | ARNT | 11874 | -1.161 | -0.5316 | No | ||
| 13 | FLT4 | 12043 | -1.210 | -0.5316 | No | ||
| 14 | SHC1 | 12913 | -1.483 | -0.5672 | No | ||
| 15 | FLT1 | 13723 | -1.780 | -0.5973 | No | ||
| 16 | HRAS | 14637 | -2.213 | -0.6298 | No | ||
| 17 | EIF2S1 | 15160 | -2.538 | -0.6388 | No | ||
| 18 | EIF2B4 | 18287 | -10.786 | -0.7258 | Yes | ||
| 19 | EIF2B5 | 18394 | -12.145 | -0.6403 | Yes | ||
| 20 | EIF1 | 18409 | -12.266 | -0.5488 | Yes | ||
| 21 | EIF2S2 | 18493 | -13.699 | -0.4504 | Yes | ||
| 22 | EIF2B1 | 18515 | -14.575 | -0.3420 | Yes | ||
| 23 | EIF2B3 | 18581 | -19.341 | -0.2001 | Yes | ||
| 24 | PTK2 | 18609 | -26.874 | 0.0004 | Yes |
