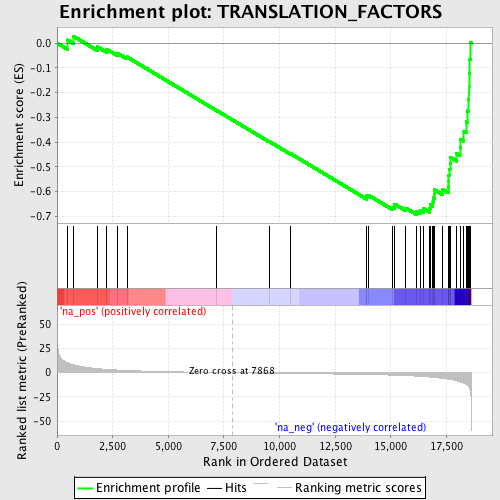
Profile of the Running ES Score & Positions of GeneSet Members on the Rank Ordered List
| Dataset | set04_transDMproB_versus_DMpreB |
| Phenotype | NoPhenotypeAvailable |
| Upregulated in class | na_neg |
| GeneSet | TRANSLATION_FACTORS |
| Enrichment Score (ES) | -0.692067 |
| Normalized Enrichment Score (NES) | -2.1134064 |
| Nominal p-value | 0.0 |
| FDR q-value | 0.0 |
| FWER p-Value | 0.0 |

| PROBE | GENE SYMBOL | GENE_TITLE | RANK IN GENE LIST | RANK METRIC SCORE | RUNNING ES | CORE ENRICHMENT | |
|---|---|---|---|---|---|---|---|
| 1 | EEF2K | 464 | 10.314 | 0.0124 | No | ||
| 2 | EIF2AK2 | 727 | 8.185 | 0.0280 | No | ||
| 3 | EIF2AK3 | 1802 | 4.228 | -0.0145 | No | ||
| 4 | GSPT2 | 2220 | 3.461 | -0.0244 | No | ||
| 5 | EIF4EBP2 | 2711 | 2.719 | -0.0409 | No | ||
| 6 | EIF4G3 | 3143 | 2.252 | -0.0559 | No | ||
| 7 | EIF3S5 | 7156 | 0.217 | -0.2711 | No | ||
| 8 | EIF2B2 | 9524 | -0.492 | -0.3968 | No | ||
| 9 | PAIP1 | 10502 | -0.768 | -0.4466 | No | ||
| 10 | EIF5B | 13911 | -1.857 | -0.6233 | No | ||
| 11 | EIF4A2 | 13921 | -1.862 | -0.6171 | No | ||
| 12 | SLC35A4 | 14014 | -1.905 | -0.6151 | No | ||
| 13 | EEF1G | 15071 | -2.470 | -0.6630 | No | ||
| 14 | EIF2S1 | 15160 | -2.538 | -0.6585 | No | ||
| 15 | EEF1A2 | 15170 | -2.549 | -0.6498 | No | ||
| 16 | EIF4G1 | 15668 | -2.930 | -0.6659 | No | ||
| 17 | EIF3S1 | 16155 | -3.477 | -0.6795 | Yes | ||
| 18 | EIF3S3 | 16327 | -3.726 | -0.6751 | Yes | ||
| 19 | EIF3S10 | 16482 | -3.975 | -0.6690 | Yes | ||
| 20 | EEF2 | 16730 | -4.420 | -0.6663 | Yes | ||
| 21 | EIF3S7 | 16769 | -4.510 | -0.6520 | Yes | ||
| 22 | EIF1AY | 16894 | -4.741 | -0.6414 | Yes | ||
| 23 | EIF5 | 16913 | -4.772 | -0.6251 | Yes | ||
| 24 | ITGB4BP | 16955 | -4.852 | -0.6097 | Yes | ||
| 25 | EIF3S6 | 16969 | -4.884 | -0.5927 | Yes | ||
| 26 | PABPC1 | 17309 | -5.730 | -0.5902 | Yes | ||
| 27 | EEF1B2 | 17575 | -6.609 | -0.5804 | Yes | ||
| 28 | EIF3S8 | 17601 | -6.716 | -0.5574 | Yes | ||
| 29 | EIF2AK1 | 17608 | -6.732 | -0.5333 | Yes | ||
| 30 | EIF4E | 17631 | -6.820 | -0.5098 | Yes | ||
| 31 | EIF4EBP1 | 17661 | -6.938 | -0.4862 | Yes | ||
| 32 | EIF4A1 | 17695 | -7.066 | -0.4623 | Yes | ||
| 33 | EEF1D | 17959 | -8.291 | -0.4464 | Yes | ||
| 34 | EIF5A | 18110 | -9.263 | -0.4209 | Yes | ||
| 35 | ETF1 | 18141 | -9.566 | -0.3878 | Yes | ||
| 36 | EIF2B4 | 18287 | -10.786 | -0.3565 | Yes | ||
| 37 | EIF2B5 | 18394 | -12.145 | -0.3181 | Yes | ||
| 38 | EIF3S9 | 18444 | -12.874 | -0.2740 | Yes | ||
| 39 | EIF2S2 | 18493 | -13.699 | -0.2269 | Yes | ||
| 40 | EIF3S4 | 18513 | -14.540 | -0.1752 | Yes | ||
| 41 | EIF2B1 | 18515 | -14.575 | -0.1224 | Yes | ||
| 42 | EIF3S2 | 18542 | -15.871 | -0.0662 | Yes | ||
| 43 | EIF2B3 | 18581 | -19.341 | 0.0019 | Yes |
