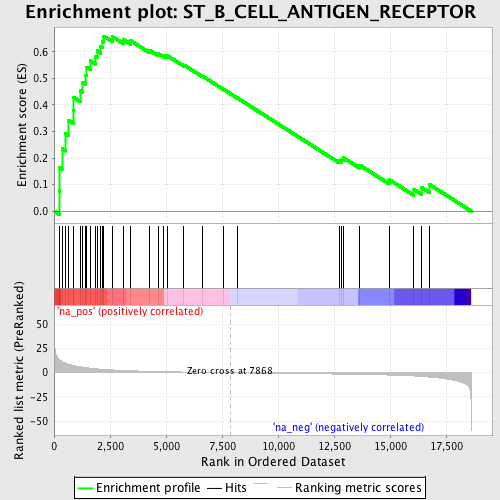
Profile of the Running ES Score & Positions of GeneSet Members on the Rank Ordered List
| Dataset | set04_transDMproB_versus_DMpreB |
| Phenotype | NoPhenotypeAvailable |
| Upregulated in class | na_pos |
| GeneSet | ST_B_CELL_ANTIGEN_RECEPTOR |
| Enrichment Score (ES) | 0.65946 |
| Normalized Enrichment Score (NES) | 1.875039 |
| Nominal p-value | 0.0 |
| FDR q-value | 0.023121132 |
| FWER p-Value | 0.172 |
| PROBE | GENE SYMBOL | GENE_TITLE | RANK IN GENE LIST | RANK METRIC SCORE | RUNNING ES | CORE ENRICHMENT | |
|---|---|---|---|---|---|---|---|
| 1 | BLNK | 239 | 13.319 | 0.0758 | Yes | ||
| 2 | ITPKB | 248 | 13.209 | 0.1633 | Yes | ||
| 3 | VAV1 | 354 | 11.615 | 0.2350 | Yes | ||
| 4 | BCR | 517 | 9.784 | 0.2915 | Yes | ||
| 5 | NFKBIL1 | 645 | 8.653 | 0.3422 | Yes | ||
| 6 | NFKBIE | 851 | 7.434 | 0.3807 | Yes | ||
| 7 | NFAT5 | 871 | 7.334 | 0.4285 | Yes | ||
| 8 | CD19 | 1167 | 6.043 | 0.4529 | Yes | ||
| 9 | NFKB2 | 1271 | 5.636 | 0.4849 | Yes | ||
| 10 | BTK | 1419 | 5.180 | 0.5114 | Yes | ||
| 11 | PIK3CD | 1460 | 5.066 | 0.5430 | Yes | ||
| 12 | PLCG2 | 1612 | 4.665 | 0.5659 | Yes | ||
| 13 | AKT3 | 1834 | 4.165 | 0.5818 | Yes | ||
| 14 | DAG1 | 1918 | 3.983 | 0.6038 | Yes | ||
| 15 | SOS2 | 2078 | 3.676 | 0.6198 | Yes | ||
| 16 | GRB2 | 2166 | 3.530 | 0.6386 | Yes | ||
| 17 | EPHB2 | 2209 | 3.475 | 0.6595 | Yes | ||
| 18 | NFKB1 | 2617 | 2.841 | 0.6565 | No | ||
| 19 | BAD | 3100 | 2.303 | 0.6459 | No | ||
| 20 | CSK | 3411 | 2.002 | 0.6425 | No | ||
| 21 | PIK3R1 | 4260 | 1.432 | 0.6064 | No | ||
| 22 | SOS1 | 4644 | 1.201 | 0.5938 | No | ||
| 23 | NFKBIB | 4891 | 1.090 | 0.5878 | No | ||
| 24 | MAP2K1 | 5069 | 1.006 | 0.5850 | No | ||
| 25 | RAF1 | 5794 | 0.702 | 0.5507 | No | ||
| 26 | LYN | 6633 | 0.389 | 0.5082 | No | ||
| 27 | PIK3CA | 7547 | 0.100 | 0.4597 | No | ||
| 28 | PPP1R13B | 8170 | -0.094 | 0.4269 | No | ||
| 29 | NFKBIA | 12722 | -1.418 | 0.1914 | No | ||
| 30 | SYK | 12848 | -1.460 | 0.1944 | No | ||
| 31 | SHC1 | 12913 | -1.483 | 0.2008 | No | ||
| 32 | AKT1 | 13635 | -1.741 | 0.1736 | No | ||
| 33 | MAP2K2 | 14962 | -2.404 | 0.1182 | No | ||
| 34 | AKT2 | 16062 | -3.372 | 0.0815 | No | ||
| 35 | ITPKA | 16416 | -3.864 | 0.0883 | No | ||
| 36 | MAPK1 | 16773 | -4.517 | 0.0992 | No |
