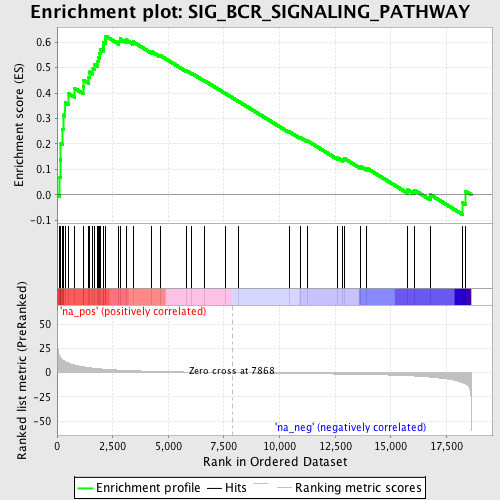
Profile of the Running ES Score & Positions of GeneSet Members on the Rank Ordered List
| Dataset | set04_transDMproB_versus_DMpreB |
| Phenotype | NoPhenotypeAvailable |
| Upregulated in class | na_pos |
| GeneSet | SIG_BCR_SIGNALING_PATHWAY |
| Enrichment Score (ES) | 0.6239649 |
| Normalized Enrichment Score (NES) | 1.8943522 |
| Nominal p-value | 0.0 |
| FDR q-value | 0.024471791 |
| FWER p-Value | 0.13 |
| PROBE | GENE SYMBOL | GENE_TITLE | RANK IN GENE LIST | RANK METRIC SCORE | RUNNING ES | CORE ENRICHMENT | |
|---|---|---|---|---|---|---|---|
| 1 | NFATC1 | 123 | 16.658 | 0.0688 | Yes | ||
| 2 | FLOT1 | 150 | 15.397 | 0.1372 | Yes | ||
| 3 | CD81 | 172 | 14.492 | 0.2017 | Yes | ||
| 4 | BLNK | 239 | 13.319 | 0.2585 | Yes | ||
| 5 | INPP5D | 273 | 12.603 | 0.3138 | Yes | ||
| 6 | VAV1 | 354 | 11.615 | 0.3621 | Yes | ||
| 7 | BCR | 517 | 9.784 | 0.3977 | Yes | ||
| 8 | FLOT2 | 799 | 7.743 | 0.4176 | Yes | ||
| 9 | CD19 | 1167 | 6.043 | 0.4252 | Yes | ||
| 10 | ITPR1 | 1193 | 5.947 | 0.4508 | Yes | ||
| 11 | BTK | 1419 | 5.180 | 0.4621 | Yes | ||
| 12 | PIK3CD | 1460 | 5.066 | 0.4829 | Yes | ||
| 13 | PLCG2 | 1612 | 4.665 | 0.4959 | Yes | ||
| 14 | MAPK3 | 1689 | 4.468 | 0.5121 | Yes | ||
| 15 | AKT3 | 1834 | 4.165 | 0.5232 | Yes | ||
| 16 | PPP3CC | 1849 | 4.130 | 0.5411 | Yes | ||
| 17 | DAG1 | 1918 | 3.983 | 0.5555 | Yes | ||
| 18 | PPP3CB | 1943 | 3.938 | 0.5721 | Yes | ||
| 19 | SOS2 | 2078 | 3.676 | 0.5815 | Yes | ||
| 20 | ITPR3 | 2092 | 3.648 | 0.5973 | Yes | ||
| 21 | GRB2 | 2166 | 3.530 | 0.6094 | Yes | ||
| 22 | GSK3B | 2190 | 3.495 | 0.6240 | Yes | ||
| 23 | PPP3CA | 2779 | 2.647 | 0.6043 | No | ||
| 24 | PDK1 | 2831 | 2.589 | 0.6133 | No | ||
| 25 | BAD | 3100 | 2.303 | 0.6093 | No | ||
| 26 | CSK | 3411 | 2.002 | 0.6017 | No | ||
| 27 | PIK3R1 | 4260 | 1.432 | 0.5625 | No | ||
| 28 | SOS1 | 4644 | 1.201 | 0.5473 | No | ||
| 29 | RAF1 | 5794 | 0.702 | 0.4886 | No | ||
| 30 | PTPRC | 6059 | 0.599 | 0.4771 | No | ||
| 31 | LYN | 6633 | 0.389 | 0.4480 | No | ||
| 32 | PIK3CA | 7547 | 0.100 | 0.3993 | No | ||
| 33 | PPP1R13B | 8170 | -0.094 | 0.3662 | No | ||
| 34 | ITPR2 | 10429 | -0.745 | 0.2480 | No | ||
| 35 | CR2 | 10938 | -0.887 | 0.2247 | No | ||
| 36 | NFATC2 | 11235 | -0.968 | 0.2131 | No | ||
| 37 | NR0B2 | 12605 | -1.376 | 0.1456 | No | ||
| 38 | SYK | 12848 | -1.460 | 0.1392 | No | ||
| 39 | SHC1 | 12913 | -1.483 | 0.1425 | No | ||
| 40 | AKT1 | 13635 | -1.741 | 0.1116 | No | ||
| 41 | GSK3A | 13913 | -1.860 | 0.1051 | No | ||
| 42 | BCL2 | 15743 | -3.007 | 0.0202 | No | ||
| 43 | AKT2 | 16062 | -3.372 | 0.0183 | No | ||
| 44 | MAPK1 | 16773 | -4.517 | 0.0006 | No | ||
| 45 | MAP4K1 | 18224 | -10.205 | -0.0313 | No | ||
| 46 | CD22 | 18353 | -11.555 | 0.0142 | No |
