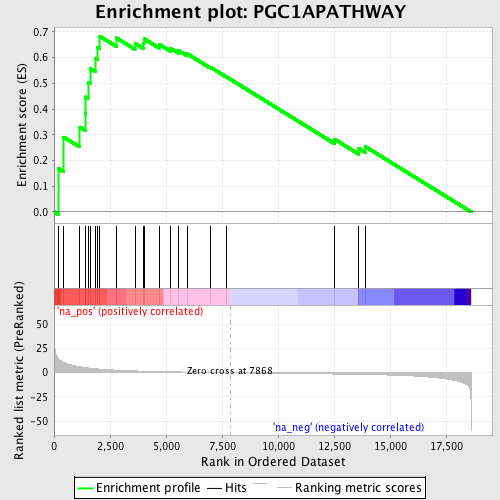
Profile of the Running ES Score & Positions of GeneSet Members on the Rank Ordered List
| Dataset | set04_transDMproB_versus_DMpreB |
| Phenotype | NoPhenotypeAvailable |
| Upregulated in class | na_pos |
| GeneSet | PGC1APATHWAY |
| Enrichment Score (ES) | 0.6836977 |
| Normalized Enrichment Score (NES) | 1.7872539 |
| Nominal p-value | 0.0 |
| FDR q-value | 0.048356622 |
| FWER p-Value | 0.493 |
| PROBE | GENE SYMBOL | GENE_TITLE | RANK IN GENE LIST | RANK METRIC SCORE | RUNNING ES | CORE ENRICHMENT | |
|---|---|---|---|---|---|---|---|
| 1 | MEF2C | 185 | 14.237 | 0.1693 | Yes | ||
| 2 | CAMK1G | 424 | 10.715 | 0.2914 | Yes | ||
| 3 | MEF2A | 1147 | 6.154 | 0.3300 | Yes | ||
| 4 | CALM3 | 1400 | 5.225 | 0.3822 | Yes | ||
| 5 | CAMK1 | 1413 | 5.202 | 0.4471 | Yes | ||
| 6 | CAMK2D | 1513 | 4.906 | 0.5035 | Yes | ||
| 7 | CAMK2G | 1609 | 4.673 | 0.5573 | Yes | ||
| 8 | PPP3CC | 1849 | 4.130 | 0.5964 | Yes | ||
| 9 | PPP3CB | 1943 | 3.938 | 0.6410 | Yes | ||
| 10 | ESRRA | 2031 | 3.765 | 0.6837 | Yes | ||
| 11 | PPP3CA | 2779 | 2.647 | 0.6768 | No | ||
| 12 | CALM2 | 3612 | 1.847 | 0.6554 | No | ||
| 13 | CAMK2A | 3986 | 1.586 | 0.6553 | No | ||
| 14 | CAMK2B | 4013 | 1.572 | 0.6737 | No | ||
| 15 | PPARA | 4690 | 1.182 | 0.6522 | No | ||
| 16 | CAMK4 | 5193 | 0.949 | 0.6371 | No | ||
| 17 | HDAC5 | 5554 | 0.791 | 0.6277 | No | ||
| 18 | MEF2B | 5948 | 0.647 | 0.6147 | No | ||
| 19 | SLC2A4 | 6969 | 0.278 | 0.5634 | No | ||
| 20 | SYT1 | 7677 | 0.056 | 0.5261 | No | ||
| 21 | CALM1 | 12515 | -1.352 | 0.2829 | No | ||
| 22 | MEF2D | 13598 | -1.728 | 0.2465 | No | ||
| 23 | YWHAH | 13894 | -1.851 | 0.2540 | No |
