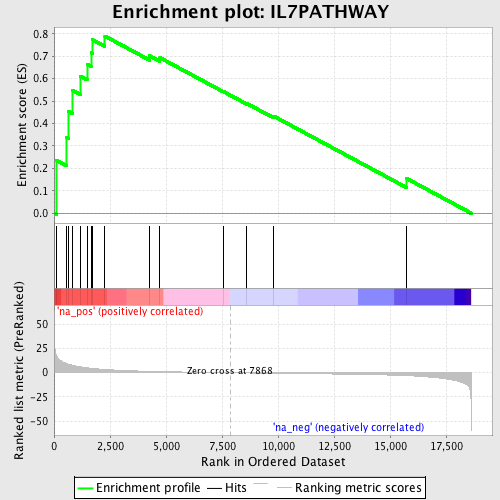
Profile of the Running ES Score & Positions of GeneSet Members on the Rank Ordered List
| Dataset | set04_transDMproB_versus_DMpreB |
| Phenotype | NoPhenotypeAvailable |
| Upregulated in class | na_pos |
| GeneSet | IL7PATHWAY |
| Enrichment Score (ES) | 0.7899268 |
| Normalized Enrichment Score (NES) | 1.8663563 |
| Nominal p-value | 0.0 |
| FDR q-value | 0.024219142 |
| FWER p-Value | 0.198 |
| PROBE | GENE SYMBOL | GENE_TITLE | RANK IN GENE LIST | RANK METRIC SCORE | RUNNING ES | CORE ENRICHMENT | |
|---|---|---|---|---|---|---|---|
| 1 | JAK3 | 108 | 17.689 | 0.2351 | Yes | ||
| 2 | FYN | 553 | 9.371 | 0.3388 | Yes | ||
| 3 | IL7R | 631 | 8.739 | 0.4537 | Yes | ||
| 4 | STAT5A | 807 | 7.710 | 0.5493 | Yes | ||
| 5 | LCK | 1176 | 6.008 | 0.6113 | Yes | ||
| 6 | IL7 | 1474 | 5.042 | 0.6640 | Yes | ||
| 7 | PTK2B | 1651 | 4.557 | 0.7166 | Yes | ||
| 8 | CREBBP | 1702 | 4.447 | 0.7745 | Yes | ||
| 9 | JAK1 | 2268 | 3.366 | 0.7899 | Yes | ||
| 10 | PIK3R1 | 4260 | 1.432 | 0.7024 | No | ||
| 11 | NMI | 4723 | 1.170 | 0.6935 | No | ||
| 12 | PIK3CA | 7547 | 0.100 | 0.5431 | No | ||
| 13 | STAT5B | 8605 | -0.224 | 0.4893 | No | ||
| 14 | IL2RG | 9795 | -0.571 | 0.4332 | No | ||
| 15 | BCL2 | 15743 | -3.007 | 0.1544 | No |
