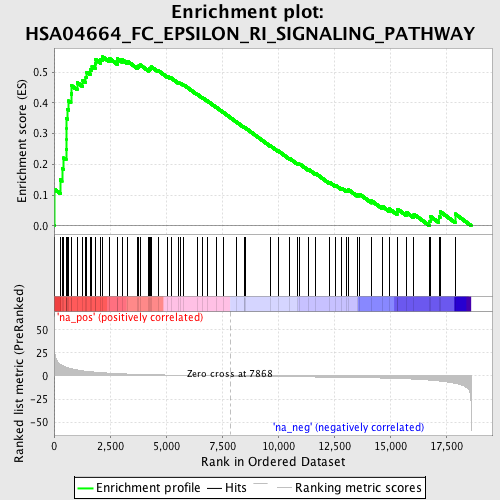
Profile of the Running ES Score & Positions of GeneSet Members on the Rank Ordered List
| Dataset | set04_transDMproB_versus_DMpreB |
| Phenotype | NoPhenotypeAvailable |
| Upregulated in class | na_pos |
| GeneSet | HSA04664_FC_EPSILON_RI_SIGNALING_PATHWAY |
| Enrichment Score (ES) | 0.54971796 |
| Normalized Enrichment Score (NES) | 1.7877783 |
| Nominal p-value | 0.0 |
| FDR q-value | 0.05115478 |
| FWER p-Value | 0.492 |
| PROBE | GENE SYMBOL | GENE_TITLE | RANK IN GENE LIST | RANK METRIC SCORE | RUNNING ES | CORE ENRICHMENT | |
|---|---|---|---|---|---|---|---|
| 1 | VAV3 | 11 | 33.496 | 0.1189 | Yes | ||
| 2 | INPP5D | 273 | 12.603 | 0.1497 | Yes | ||
| 3 | VAV1 | 354 | 11.615 | 0.1869 | Yes | ||
| 4 | LAT | 432 | 10.644 | 0.2207 | Yes | ||
| 5 | PLA2G12A | 535 | 9.572 | 0.2493 | Yes | ||
| 6 | IL5 | 548 | 9.406 | 0.2822 | Yes | ||
| 7 | FYN | 553 | 9.371 | 0.3154 | Yes | ||
| 8 | MAPK9 | 558 | 9.321 | 0.3485 | Yes | ||
| 9 | RAC2 | 606 | 8.959 | 0.3779 | Yes | ||
| 10 | PIK3CG | 650 | 8.605 | 0.4062 | Yes | ||
| 11 | MAPK14 | 754 | 8.054 | 0.4294 | Yes | ||
| 12 | LCP2 | 783 | 7.814 | 0.4558 | Yes | ||
| 13 | PRKCB1 | 1028 | 6.604 | 0.4662 | Yes | ||
| 14 | PRKCD | 1279 | 5.615 | 0.4727 | Yes | ||
| 15 | BTK | 1419 | 5.180 | 0.4837 | Yes | ||
| 16 | PIK3CD | 1460 | 5.066 | 0.4996 | Yes | ||
| 17 | PLCG2 | 1612 | 4.665 | 0.5081 | Yes | ||
| 18 | MAPK3 | 1689 | 4.468 | 0.5199 | Yes | ||
| 19 | AKT3 | 1834 | 4.165 | 0.5270 | Yes | ||
| 20 | KRAS | 1847 | 4.132 | 0.5411 | Yes | ||
| 21 | SOS2 | 2078 | 3.676 | 0.5418 | Yes | ||
| 22 | GRB2 | 2166 | 3.530 | 0.5497 | Yes | ||
| 23 | MAP2K3 | 2462 | 3.060 | 0.5447 | No | ||
| 24 | FCER1G | 2820 | 2.607 | 0.5348 | No | ||
| 25 | PDK1 | 2831 | 2.589 | 0.5435 | No | ||
| 26 | CSF2 | 3037 | 2.356 | 0.5408 | No | ||
| 27 | FCER1A | 3278 | 2.117 | 0.5354 | No | ||
| 28 | MAPK13 | 3729 | 1.763 | 0.5174 | No | ||
| 29 | MS4A2 | 3786 | 1.720 | 0.5206 | No | ||
| 30 | TNF | 3842 | 1.682 | 0.5236 | No | ||
| 31 | VAV2 | 4233 | 1.446 | 0.5077 | No | ||
| 32 | PIK3R1 | 4260 | 1.432 | 0.5114 | No | ||
| 33 | GAB2 | 4314 | 1.401 | 0.5136 | No | ||
| 34 | PIK3R5 | 4339 | 1.390 | 0.5172 | No | ||
| 35 | SOS1 | 4644 | 1.201 | 0.5051 | No | ||
| 36 | MAP2K1 | 5069 | 1.006 | 0.4858 | No | ||
| 37 | RAC1 | 5218 | 0.936 | 0.4812 | No | ||
| 38 | PLA2G2D | 5572 | 0.784 | 0.4649 | No | ||
| 39 | RAC3 | 5638 | 0.760 | 0.4641 | No | ||
| 40 | RAF1 | 5794 | 0.702 | 0.4583 | No | ||
| 41 | PLA2G12B | 6400 | 0.470 | 0.4273 | No | ||
| 42 | LYN | 6633 | 0.389 | 0.4162 | No | ||
| 43 | PLA2G1B | 6831 | 0.323 | 0.4067 | No | ||
| 44 | PLCG1 | 7237 | 0.186 | 0.3856 | No | ||
| 45 | PIK3CA | 7547 | 0.100 | 0.3693 | No | ||
| 46 | PLA2G3 | 8120 | -0.079 | 0.3387 | No | ||
| 47 | IL4 | 8484 | -0.187 | 0.3198 | No | ||
| 48 | PRKCA | 8501 | -0.195 | 0.3196 | No | ||
| 49 | PLA2G5 | 8530 | -0.201 | 0.3188 | No | ||
| 50 | PLA2G6 | 9654 | -0.530 | 0.2601 | No | ||
| 51 | PLA2G2E | 10001 | -0.630 | 0.2437 | No | ||
| 52 | PLA2G10 | 10518 | -0.771 | 0.2186 | No | ||
| 53 | MAP2K6 | 10855 | -0.863 | 0.2036 | No | ||
| 54 | PLA2G2A | 10964 | -0.893 | 0.2010 | No | ||
| 55 | MAP2K7 | 11372 | -1.011 | 0.1826 | No | ||
| 56 | PRKCE | 11664 | -1.095 | 0.1708 | No | ||
| 57 | MAP2K4 | 12313 | -1.290 | 0.1405 | No | ||
| 58 | IL3 | 12552 | -1.361 | 0.1325 | No | ||
| 59 | SYK | 12848 | -1.460 | 0.1218 | No | ||
| 60 | MAPK11 | 13069 | -1.528 | 0.1154 | No | ||
| 61 | PLA2G2F | 13136 | -1.553 | 0.1174 | No | ||
| 62 | PLA2G4A | 13526 | -1.703 | 0.1025 | No | ||
| 63 | AKT1 | 13635 | -1.741 | 0.1029 | No | ||
| 64 | MAPK10 | 14173 | -1.978 | 0.0809 | No | ||
| 65 | HRAS | 14637 | -2.213 | 0.0639 | No | ||
| 66 | MAP2K2 | 14962 | -2.404 | 0.0550 | No | ||
| 67 | PIK3R2 | 15311 | -2.649 | 0.0456 | No | ||
| 68 | IL13 | 15328 | -2.665 | 0.0543 | No | ||
| 69 | MAPK8 | 15721 | -2.984 | 0.0438 | No | ||
| 70 | AKT2 | 16062 | -3.372 | 0.0375 | No | ||
| 71 | MAPK1 | 16773 | -4.517 | 0.0153 | No | ||
| 72 | NRAS | 16794 | -4.560 | 0.0305 | No | ||
| 73 | MAPK12 | 17181 | -5.426 | 0.0290 | No | ||
| 74 | PIK3R3 | 17231 | -5.558 | 0.0462 | No | ||
| 75 | PIK3CB | 17904 | -7.974 | 0.0384 | No |
