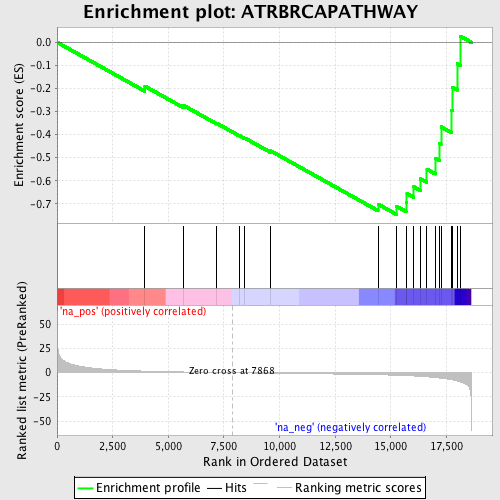
Profile of the Running ES Score & Positions of GeneSet Members on the Rank Ordered List
| Dataset | set04_transDMproB_versus_DMpreB |
| Phenotype | NoPhenotypeAvailable |
| Upregulated in class | na_neg |
| GeneSet | ATRBRCAPATHWAY |
| Enrichment Score (ES) | -0.7459956 |
| Normalized Enrichment Score (NES) | -1.8862227 |
| Nominal p-value | 0.0020120724 |
| FDR q-value | 0.0048745465 |
| FWER p-Value | 0.077 |
| PROBE | GENE SYMBOL | GENE_TITLE | RANK IN GENE LIST | RANK METRIC SCORE | RUNNING ES | CORE ENRICHMENT | |
|---|---|---|---|---|---|---|---|
| 1 | TP53 | 3947 | 1.611 | -0.1904 | No | ||
| 2 | FANCA | 5676 | 0.741 | -0.2732 | No | ||
| 3 | BRCA2 | 7179 | 0.210 | -0.3512 | No | ||
| 4 | FANCG | 8202 | -0.102 | -0.4047 | No | ||
| 5 | BRCA1 | 8441 | -0.173 | -0.4152 | No | ||
| 6 | RAD50 | 9604 | -0.516 | -0.4706 | No | ||
| 7 | RAD9A | 14425 | -2.102 | -0.7013 | No | ||
| 8 | RAD1 | 15257 | -2.607 | -0.7106 | Yes | ||
| 9 | FANCC | 15686 | -2.947 | -0.6937 | Yes | ||
| 10 | TREX1 | 15726 | -2.990 | -0.6552 | Yes | ||
| 11 | ATM | 16035 | -3.341 | -0.6264 | Yes | ||
| 12 | RAD17 | 16338 | -3.743 | -0.5919 | Yes | ||
| 13 | FANCE | 16625 | -4.204 | -0.5502 | Yes | ||
| 14 | HUS1 | 17006 | -4.961 | -0.5033 | Yes | ||
| 15 | CHEK2 | 17195 | -5.457 | -0.4394 | Yes | ||
| 16 | CHEK1 | 17258 | -5.616 | -0.3665 | Yes | ||
| 17 | ATR | 17743 | -7.261 | -0.2940 | Yes | ||
| 18 | MRE11A | 17765 | -7.355 | -0.1954 | Yes | ||
| 19 | FANCD2 | 17981 | -8.432 | -0.0925 | Yes | ||
| 20 | RAD51 | 18119 | -9.329 | 0.0267 | Yes |
