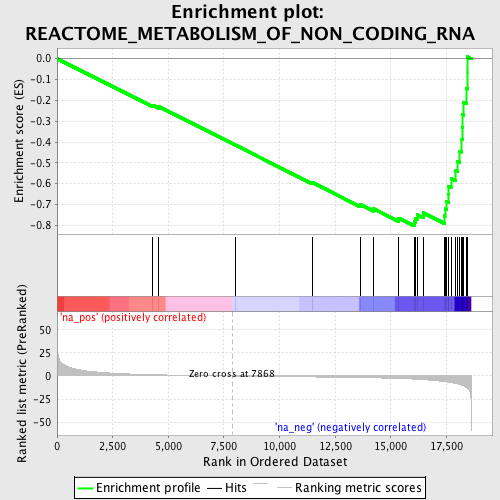
Profile of the Running ES Score & Positions of GeneSet Members on the Rank Ordered List
| Dataset | set04_transDMproB_versus_DMpreB |
| Phenotype | NoPhenotypeAvailable |
| Upregulated in class | na_neg |
| GeneSet | REACTOME_METABOLISM_OF_NON_CODING_RNA |
| Enrichment Score (ES) | -0.8031636 |
| Normalized Enrichment Score (NES) | -2.2077541 |
| Nominal p-value | 0.0 |
| FDR q-value | 0.0 |
| FWER p-Value | 0.0 |
| PROBE | GENE SYMBOL | GENE_TITLE | RANK IN GENE LIST | RANK METRIC SCORE | RUNNING ES | CORE ENRICHMENT | |
|---|---|---|---|---|---|---|---|
| 1 | TPR | 4303 | 1.407 | -0.2231 | No | ||
| 2 | NUP153 | 4572 | 1.239 | -0.2302 | No | ||
| 3 | NUP35 | 8021 | -0.051 | -0.4154 | No | ||
| 4 | SNRPE | 11463 | -1.035 | -0.5943 | No | ||
| 5 | NUP62 | 13644 | -1.743 | -0.7012 | No | ||
| 6 | NUP188 | 14211 | -1.994 | -0.7198 | No | ||
| 7 | RANBP2 | 15351 | -2.683 | -0.7652 | No | ||
| 8 | SNRPF | 16058 | -3.366 | -0.7832 | Yes | ||
| 9 | SIP1 | 16108 | -3.422 | -0.7655 | Yes | ||
| 10 | SNRPD3 | 16192 | -3.532 | -0.7490 | Yes | ||
| 11 | SNRPG | 16459 | -3.937 | -0.7400 | Yes | ||
| 12 | NCBP2 | 17401 | -6.011 | -0.7549 | Yes | ||
| 13 | NUP155 | 17436 | -6.102 | -0.7205 | Yes | ||
| 14 | SNRPD2 | 17510 | -6.413 | -0.6864 | Yes | ||
| 15 | NUP160 | 17587 | -6.659 | -0.6509 | Yes | ||
| 16 | NUP37 | 17592 | -6.686 | -0.6115 | Yes | ||
| 17 | GEMIN4 | 17706 | -7.113 | -0.5753 | Yes | ||
| 18 | NUP54 | 17920 | -8.056 | -0.5390 | Yes | ||
| 19 | NUP107 | 18002 | -8.549 | -0.4926 | Yes | ||
| 20 | NUP93 | 18105 | -9.235 | -0.4433 | Yes | ||
| 21 | RAE1 | 18196 | -9.988 | -0.3888 | Yes | ||
| 22 | SNRPB | 18222 | -10.194 | -0.3297 | Yes | ||
| 23 | NUPL2 | 18230 | -10.274 | -0.2690 | Yes | ||
| 24 | SNUPN | 18262 | -10.525 | -0.2082 | Yes | ||
| 25 | CLNS1A | 18406 | -12.251 | -0.1432 | Yes | ||
| 26 | PRMT5 | 18450 | -13.000 | -0.0684 | Yes | ||
| 27 | NUP43 | 18451 | -13.016 | 0.0089 | Yes |
