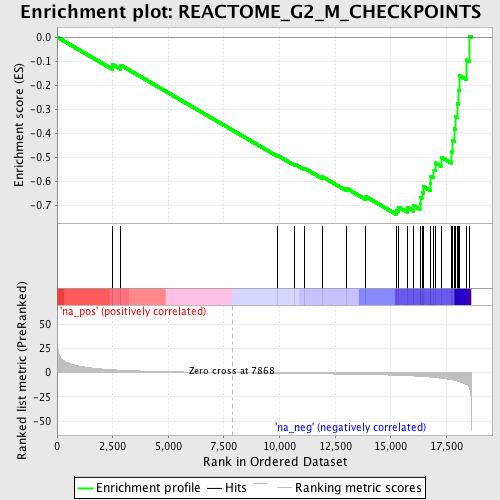
Profile of the Running ES Score & Positions of GeneSet Members on the Rank Ordered List
| Dataset | set04_transDMproB_versus_DMpreB |
| Phenotype | NoPhenotypeAvailable |
| Upregulated in class | na_neg |
| GeneSet | REACTOME_G2_M_CHECKPOINTS |
| Enrichment Score (ES) | -0.7368575 |
| Normalized Enrichment Score (NES) | -2.0746639 |
| Nominal p-value | 0.0 |
| FDR q-value | 0.0 |
| FWER p-Value | 0.0 |
| PROBE | GENE SYMBOL | GENE_TITLE | RANK IN GENE LIST | RANK METRIC SCORE | RUNNING ES | CORE ENRICHMENT | |
|---|---|---|---|---|---|---|---|
| 1 | CCNB1 | 2502 | 3.007 | -0.1144 | No | ||
| 2 | CDC25C | 2862 | 2.542 | -0.1166 | No | ||
| 3 | CCNB2 | 9916 | -0.606 | -0.4920 | No | ||
| 4 | ORC4L | 10682 | -0.819 | -0.5276 | No | ||
| 5 | WEE1 | 11125 | -0.938 | -0.5451 | No | ||
| 6 | RPA1 | 11919 | -1.172 | -0.5799 | No | ||
| 7 | CDC7 | 12992 | -1.507 | -0.6274 | No | ||
| 8 | MCM5 | 13849 | -1.833 | -0.6612 | No | ||
| 9 | RAD1 | 15257 | -2.607 | -0.7193 | Yes | ||
| 10 | MCM2 | 15360 | -2.690 | -0.7067 | Yes | ||
| 11 | MCM6 | 15736 | -3.002 | -0.7067 | Yes | ||
| 12 | ATM | 16035 | -3.341 | -0.7003 | Yes | ||
| 13 | MCM4 | 16312 | -3.695 | -0.6903 | Yes | ||
| 14 | CDK2 | 16319 | -3.710 | -0.6656 | Yes | ||
| 15 | MCM7 | 16403 | -3.842 | -0.6443 | Yes | ||
| 16 | CDC25A | 16478 | -3.968 | -0.6216 | Yes | ||
| 17 | RPA3 | 16771 | -4.515 | -0.6069 | Yes | ||
| 18 | MCM3 | 16797 | -4.561 | -0.5776 | Yes | ||
| 19 | MCM10 | 16938 | -4.828 | -0.5526 | Yes | ||
| 20 | HUS1 | 17006 | -4.961 | -0.5229 | Yes | ||
| 21 | CHEK1 | 17258 | -5.616 | -0.4986 | Yes | ||
| 22 | RAD9B | 17717 | -7.153 | -0.4751 | Yes | ||
| 23 | CDC45L | 17767 | -7.357 | -0.4283 | Yes | ||
| 24 | RFC5 | 17863 | -7.807 | -0.3809 | Yes | ||
| 25 | ORC1L | 17922 | -8.076 | -0.3297 | Yes | ||
| 26 | RPA2 | 17977 | -8.392 | -0.2762 | Yes | ||
| 27 | RFC3 | 18061 | -8.903 | -0.2207 | Yes | ||
| 28 | RFC4 | 18097 | -9.168 | -0.1610 | Yes | ||
| 29 | ORC2L | 18387 | -12.097 | -0.0952 | Yes | ||
| 30 | ORC5L | 18543 | -15.972 | 0.0039 | Yes |
