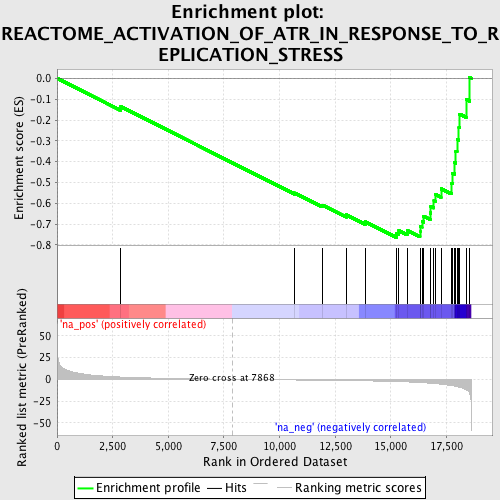
Profile of the Running ES Score & Positions of GeneSet Members on the Rank Ordered List
| Dataset | set04_transDMproB_versus_DMpreB |
| Phenotype | NoPhenotypeAvailable |
| Upregulated in class | na_neg |
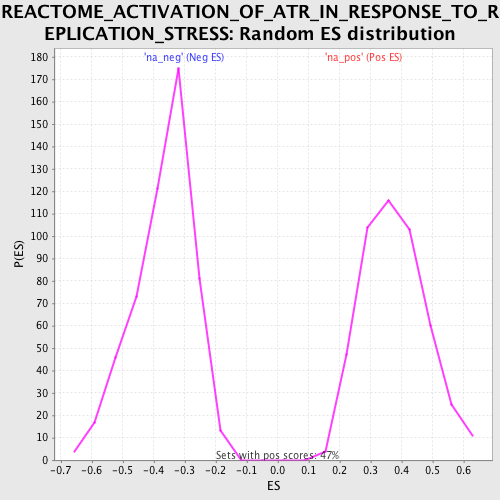
| GeneSet | REACTOME_ACTIVATION_OF_ATR_IN_RESPONSE_TO_REPLICATION_STRESS |
| Enrichment Score (ES) | -0.76448226 |
| Normalized Enrichment Score (NES) | -2.0728552 |
| Nominal p-value | 0.0 |
| FDR q-value | 5.191176E-5 |
| FWER p-Value | 0.0010 |
| PROBE | GENE SYMBOL | GENE_TITLE | RANK IN GENE LIST | RANK METRIC SCORE | RUNNING ES | CORE ENRICHMENT | |
|---|---|---|---|---|---|---|---|
| 1 | CDC25C | 2862 | 2.542 | -0.1359 | No | ||
| 2 | ORC4L | 10682 | -0.819 | -0.5507 | No | ||
| 3 | RPA1 | 11919 | -1.172 | -0.6088 | No | ||
| 4 | CDC7 | 12992 | -1.507 | -0.6558 | No | ||
| 5 | MCM5 | 13849 | -1.833 | -0.6888 | No | ||
| 6 | RAD1 | 15257 | -2.607 | -0.7460 | Yes | ||
| 7 | MCM2 | 15360 | -2.690 | -0.7323 | Yes | ||
| 8 | MCM6 | 15736 | -3.002 | -0.7312 | Yes | ||
| 9 | MCM4 | 16312 | -3.695 | -0.7359 | Yes | ||
| 10 | CDK2 | 16319 | -3.710 | -0.7099 | Yes | ||
| 11 | MCM7 | 16403 | -3.842 | -0.6870 | Yes | ||
| 12 | CDC25A | 16478 | -3.968 | -0.6628 | Yes | ||
| 13 | RPA3 | 16771 | -4.515 | -0.6465 | Yes | ||
| 14 | MCM3 | 16797 | -4.561 | -0.6154 | Yes | ||
| 15 | MCM10 | 16938 | -4.828 | -0.5886 | Yes | ||
| 16 | HUS1 | 17006 | -4.961 | -0.5570 | Yes | ||
| 17 | CHEK1 | 17258 | -5.616 | -0.5306 | Yes | ||
| 18 | RAD9B | 17717 | -7.153 | -0.5045 | Yes | ||
| 19 | CDC45L | 17767 | -7.357 | -0.4548 | Yes | ||
| 20 | RFC5 | 17863 | -7.807 | -0.4045 | Yes | ||
| 21 | ORC1L | 17922 | -8.076 | -0.3503 | Yes | ||
| 22 | RPA2 | 17977 | -8.392 | -0.2936 | Yes | ||
| 23 | RFC3 | 18061 | -8.903 | -0.2348 | Yes | ||
| 24 | RFC4 | 18097 | -9.168 | -0.1716 | Yes | ||
| 25 | ORC2L | 18387 | -12.097 | -0.1012 | Yes | ||
| 26 | ORC5L | 18543 | -15.972 | 0.0039 | Yes |