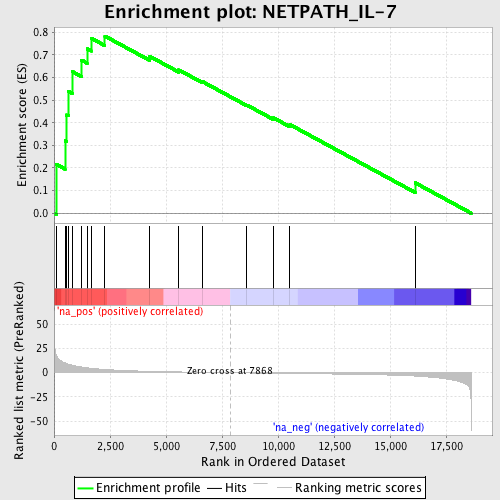
Profile of the Running ES Score & Positions of GeneSet Members on the Rank Ordered List
| Dataset | set04_transDMproB_versus_DMpreB |
| Phenotype | NoPhenotypeAvailable |
| Upregulated in class | na_pos |
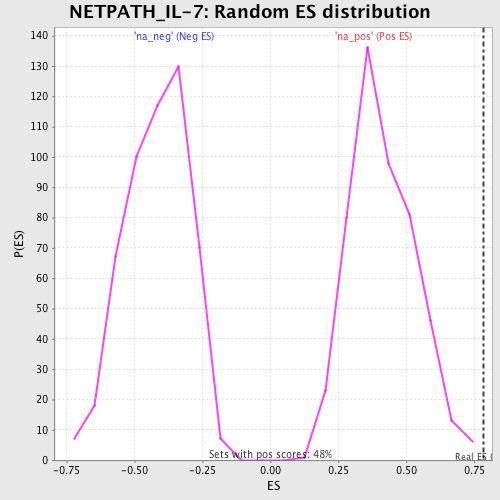
| GeneSet | NETPATH_IL-7 |
| Enrichment Score (ES) | 0.7833307 |
| Normalized Enrichment Score (NES) | 1.9007643 |
| Nominal p-value | 0.0 |
| FDR q-value | 0.04287053 |
| FWER p-Value | 0.174 |
| PROBE | GENE SYMBOL | GENE_TITLE | RANK IN GENE LIST | RANK METRIC SCORE | RUNNING ES | CORE ENRICHMENT | |
|---|---|---|---|---|---|---|---|
| 1 | JAK3 | 108 | 17.689 | 0.2155 | Yes | ||
| 2 | STAT3 | 490 | 10.026 | 0.3205 | Yes | ||
| 3 | FYN | 553 | 9.371 | 0.4344 | Yes | ||
| 4 | IL7R | 631 | 8.739 | 0.5397 | Yes | ||
| 5 | STAT5A | 807 | 7.710 | 0.6267 | Yes | ||
| 6 | MCL1 | 1227 | 5.811 | 0.6769 | Yes | ||
| 7 | IL7 | 1474 | 5.042 | 0.7268 | Yes | ||
| 8 | PTK2B | 1651 | 4.557 | 0.7743 | Yes | ||
| 9 | JAK1 | 2268 | 3.366 | 0.7833 | Yes | ||
| 10 | PIK3R1 | 4260 | 1.432 | 0.6942 | No | ||
| 11 | INSL3 | 5570 | 0.784 | 0.6337 | No | ||
| 12 | LYN | 6633 | 0.389 | 0.5814 | No | ||
| 13 | STAT5B | 8605 | -0.224 | 0.4783 | No | ||
| 14 | IL2RG | 9795 | -0.571 | 0.4215 | No | ||
| 15 | IRS1 | 10527 | -0.772 | 0.3919 | No | ||
| 16 | BCL2L11 | 16118 | -3.432 | 0.1343 | No |