Profile of the Running ES Score & Positions of GeneSet Members on the Rank Ordered List
| Dataset | set04_transDMpreB_versus_WTpreB |
| Phenotype | NoPhenotypeAvailable |
| Upregulated in class | na_pos |
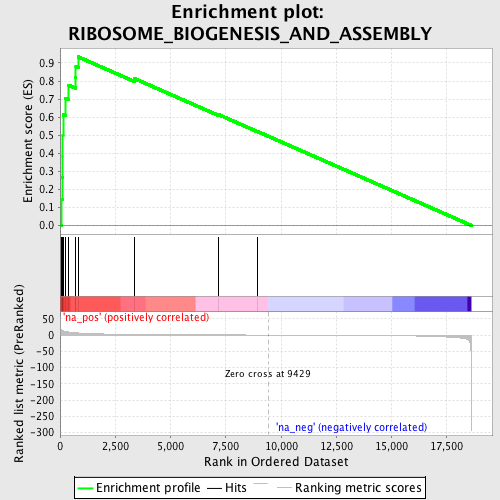
| GeneSet | RIBOSOME_BIOGENESIS_AND_ASSEMBLY |
| Enrichment Score (ES) | 0.93372345 |
| Normalized Enrichment Score (NES) | 2.1312387 |
| Nominal p-value | 0.0 |
| FDR q-value | 6.6607456E-5 |
| FWER p-Value | 0.0010 |
| PROBE | GENE SYMBOL | GENE_TITLE | RANK IN GENE LIST | RANK METRIC SCORE | RUNNING ES | CORE ENRICHMENT | |
|---|---|---|---|---|---|---|---|
| 1 | FBL | 47 | 16.998 | 0.1467 | Yes | ||
| 2 | NOLA2 | 103 | 13.964 | 0.2663 | Yes | ||
| 3 | RRP9 | 128 | 13.247 | 0.3813 | Yes | ||
| 4 | EXOSC7 | 129 | 13.224 | 0.4973 | Yes | ||
| 5 | SDAD1 | 131 | 13.197 | 0.6131 | Yes | ||
| 6 | EXOSC2 | 234 | 10.908 | 0.7034 | Yes | ||
| 7 | NOLC1 | 378 | 9.329 | 0.7776 | Yes | ||
| 8 | GEMIN4 | 708 | 6.976 | 0.8211 | Yes | ||
| 9 | POP4 | 716 | 6.937 | 0.8816 | Yes | ||
| 10 | NOL5A | 817 | 6.547 | 0.9337 | Yes | ||
| 11 | NPM1 | 3360 | 1.903 | 0.8138 | No | ||
| 12 | EXOSC3 | 7174 | 0.566 | 0.6138 | No | ||
| 13 | RPS14 | 8920 | 0.133 | 0.5212 | No |
