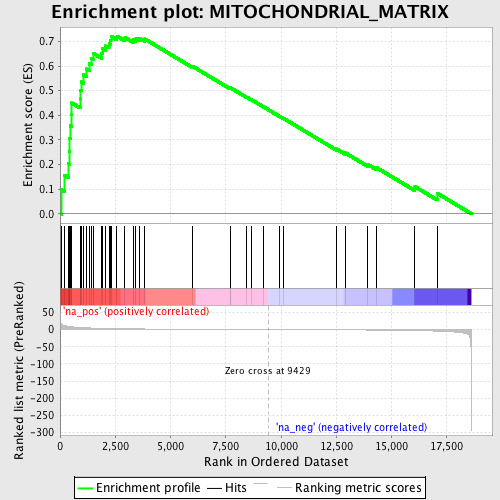
Profile of the Running ES Score & Positions of GeneSet Members on the Rank Ordered List
| Dataset | set04_transDMpreB_versus_WTpreB |
| Phenotype | NoPhenotypeAvailable |
| Upregulated in class | na_pos |
| GeneSet | MITOCHONDRIAL_MATRIX |
| Enrichment Score (ES) | 0.7213909 |
| Normalized Enrichment Score (NES) | 2.0988793 |
| Nominal p-value | 0.0 |
| FDR q-value | 1.1032019E-4 |
| FWER p-Value | 0.0020 |
| PROBE | GENE SYMBOL | GENE_TITLE | RANK IN GENE LIST | RANK METRIC SCORE | RUNNING ES | CORE ENRICHMENT | |
|---|---|---|---|---|---|---|---|
| 1 | MRPS10 | 51 | 16.878 | 0.0977 | Yes | ||
| 2 | MRPL12 | 207 | 11.350 | 0.1570 | Yes | ||
| 3 | MRPL23 | 372 | 9.348 | 0.2038 | Yes | ||
| 4 | SUPV3L1 | 422 | 8.971 | 0.2546 | Yes | ||
| 5 | MRPS15 | 437 | 8.862 | 0.3066 | Yes | ||
| 6 | MRPS12 | 456 | 8.687 | 0.3574 | Yes | ||
| 7 | BCKDHB | 524 | 8.113 | 0.4021 | Yes | ||
| 8 | MRPS18A | 529 | 8.091 | 0.4500 | Yes | ||
| 9 | TIMM44 | 908 | 6.136 | 0.4662 | Yes | ||
| 10 | PIN4 | 912 | 6.131 | 0.5025 | Yes | ||
| 11 | MRPL55 | 960 | 5.951 | 0.5354 | Yes | ||
| 12 | ALDH4A1 | 1050 | 5.608 | 0.5640 | Yes | ||
| 13 | MRPL40 | 1178 | 5.182 | 0.5881 | Yes | ||
| 14 | POLG2 | 1323 | 4.772 | 0.6087 | Yes | ||
| 15 | MRPS28 | 1407 | 4.500 | 0.6310 | Yes | ||
| 16 | ETFA | 1508 | 4.259 | 0.6510 | Yes | ||
| 17 | ETFB | 1865 | 3.519 | 0.6528 | Yes | ||
| 18 | MRPL10 | 1929 | 3.412 | 0.6697 | Yes | ||
| 19 | NFS1 | 2066 | 3.195 | 0.6814 | Yes | ||
| 20 | MRPS24 | 2214 | 2.980 | 0.6913 | Yes | ||
| 21 | ACADM | 2287 | 2.876 | 0.7045 | Yes | ||
| 22 | DNAJA3 | 2305 | 2.857 | 0.7206 | Yes | ||
| 23 | MRPS11 | 2573 | 2.547 | 0.7214 | Yes | ||
| 24 | TFB2M | 2935 | 2.233 | 0.7152 | No | ||
| 25 | NDUFAB1 | 3303 | 1.944 | 0.7071 | No | ||
| 26 | MRPS18C | 3433 | 1.855 | 0.7112 | No | ||
| 27 | MRPS35 | 3597 | 1.763 | 0.7129 | No | ||
| 28 | MRPL51 | 3835 | 1.637 | 0.7099 | No | ||
| 29 | DBT | 6002 | 0.867 | 0.5984 | No | ||
| 30 | MRPS21 | 7690 | 0.433 | 0.5102 | No | ||
| 31 | MRPS16 | 7717 | 0.427 | 0.5113 | No | ||
| 32 | MRPS22 | 8435 | 0.250 | 0.4742 | No | ||
| 33 | PITRM1 | 8659 | 0.193 | 0.4634 | No | ||
| 34 | ATP5F1 | 9182 | 0.061 | 0.4356 | No | ||
| 35 | GRPEL1 | 9916 | -0.132 | 0.3969 | No | ||
| 36 | CS | 10116 | -0.181 | 0.3873 | No | ||
| 37 | MRPL52 | 12507 | -0.802 | 0.2634 | No | ||
| 38 | BCKDK | 12908 | -0.918 | 0.2474 | No | ||
| 39 | MRPS36 | 13908 | -1.288 | 0.2012 | No | ||
| 40 | CASQ1 | 14302 | -1.438 | 0.1886 | No | ||
| 41 | BCKDHA | 16060 | -2.729 | 0.1103 | No | ||
| 42 | NR3C1 | 17064 | -4.576 | 0.0836 | No |
