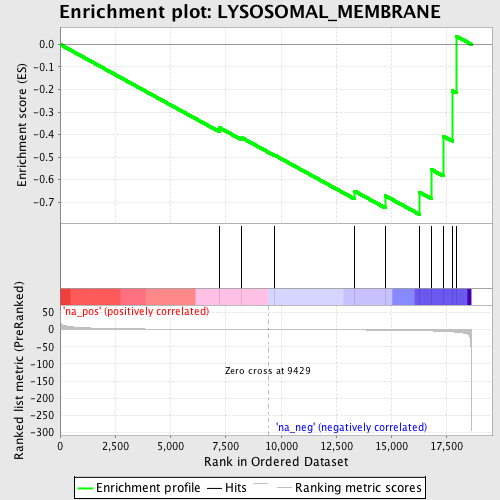
Profile of the Running ES Score & Positions of GeneSet Members on the Rank Ordered List
| Dataset | set04_transDMpreB_versus_WTpreB |
| Phenotype | NoPhenotypeAvailable |
| Upregulated in class | na_neg |
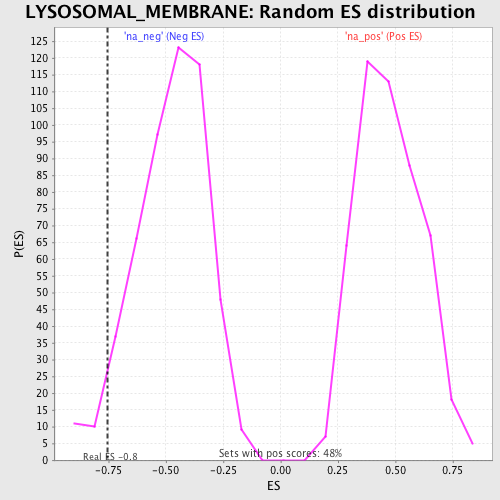
| GeneSet | LYSOSOMAL_MEMBRANE |
| Enrichment Score (ES) | -0.75430775 |
| Normalized Enrichment Score (NES) | -1.5727504 |
| Nominal p-value | 0.040462427 |
| FDR q-value | 1.0 |
| FWER p-Value | 1.0 |
| PROBE | GENE SYMBOL | GENE_TITLE | RANK IN GENE LIST | RANK METRIC SCORE | RUNNING ES | CORE ENRICHMENT | |
|---|---|---|---|---|---|---|---|
| 1 | MYO7A | 7223 | 0.554 | -0.3698 | No | ||
| 2 | ABCA2 | 8231 | 0.294 | -0.4142 | No | ||
| 3 | CD63 | 9712 | -0.074 | -0.4913 | No | ||
| 4 | TRIM23 | 13325 | -1.060 | -0.6504 | No | ||
| 5 | LAMP3 | 14721 | -1.636 | -0.6712 | Yes | ||
| 6 | SLC17A5 | 16268 | -2.989 | -0.6554 | Yes | ||
| 7 | CORO1A | 16795 | -3.910 | -0.5544 | Yes | ||
| 8 | LAMP2 | 17336 | -5.349 | -0.4064 | Yes | ||
| 9 | CLN5 | 17751 | -6.737 | -0.2058 | Yes | ||
| 10 | CTNS | 17933 | -7.625 | 0.0367 | Yes |