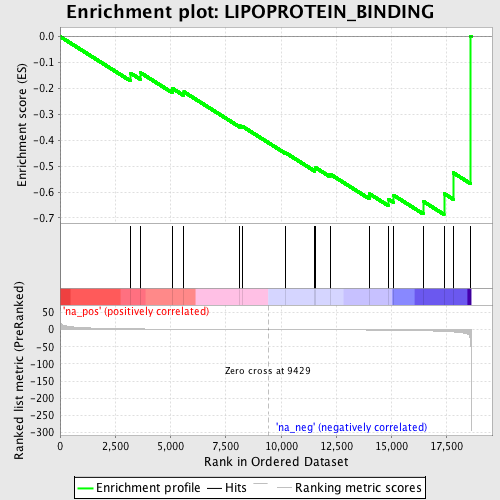
Profile of the Running ES Score & Positions of GeneSet Members on the Rank Ordered List
| Dataset | set04_transDMpreB_versus_WTpreB |
| Phenotype | NoPhenotypeAvailable |
| Upregulated in class | na_neg |
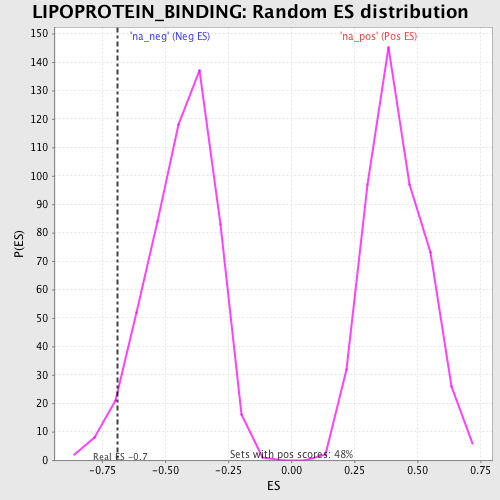
| GeneSet | LIPOPROTEIN_BINDING |
| Enrichment Score (ES) | -0.6867175 |
| Normalized Enrichment Score (NES) | -1.5803039 |
| Nominal p-value | 0.038314175 |
| FDR q-value | 1.0 |
| FWER p-Value | 1.0 |
| PROBE | GENE SYMBOL | GENE_TITLE | RANK IN GENE LIST | RANK METRIC SCORE | RUNNING ES | CORE ENRICHMENT | |
|---|---|---|---|---|---|---|---|
| 1 | APOB48R | 3182 | 2.044 | -0.1408 | No | ||
| 2 | LRP6 | 3644 | 1.740 | -0.1398 | No | ||
| 3 | STAB2 | 5089 | 1.145 | -0.2004 | No | ||
| 4 | VLDLR | 5605 | 0.984 | -0.2135 | No | ||
| 5 | APOL2 | 8135 | 0.323 | -0.3447 | No | ||
| 6 | COLEC12 | 8250 | 0.289 | -0.3465 | No | ||
| 7 | STAB1 | 10214 | -0.202 | -0.4491 | No | ||
| 8 | LDLR | 11534 | -0.517 | -0.5123 | No | ||
| 9 | CXCL16 | 11574 | -0.528 | -0.5066 | No | ||
| 10 | APOA4 | 12220 | -0.708 | -0.5308 | No | ||
| 11 | ANKRA2 | 14004 | -1.323 | -0.6070 | No | ||
| 12 | LRP1 | 14855 | -1.717 | -0.6273 | No | ||
| 13 | CDH13 | 15099 | -1.861 | -0.6128 | No | ||
| 14 | MAPT | 16433 | -3.269 | -0.6360 | Yes | ||
| 15 | SORL1 | 17378 | -5.468 | -0.6056 | Yes | ||
| 16 | LRPAP1 | 17794 | -6.898 | -0.5257 | Yes | ||
| 17 | TLR6 | 18585 | -38.435 | 0.0017 | Yes |