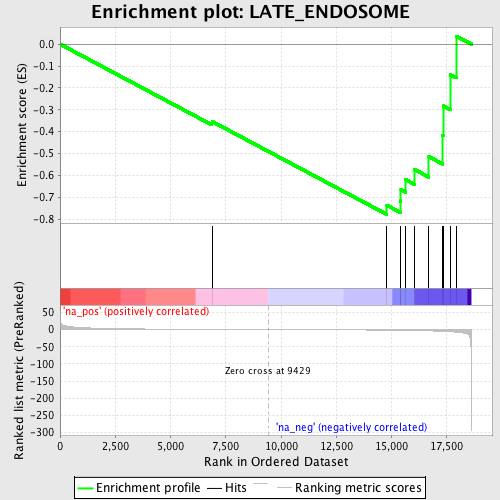
Profile of the Running ES Score & Positions of GeneSet Members on the Rank Ordered List
| Dataset | set04_transDMpreB_versus_WTpreB |
| Phenotype | NoPhenotypeAvailable |
| Upregulated in class | na_neg |
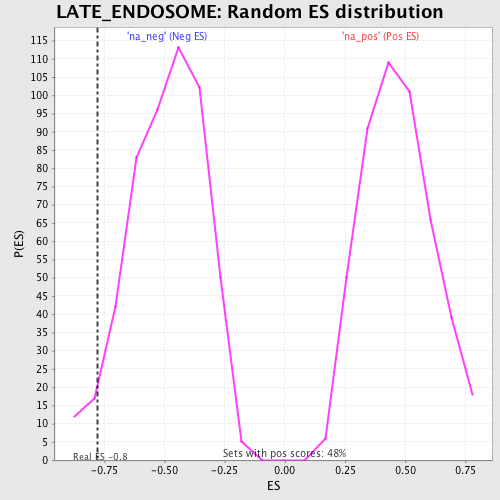
| GeneSet | LATE_ENDOSOME |
| Enrichment Score (ES) | -0.77883744 |
| Normalized Enrichment Score (NES) | -1.5877067 |
| Nominal p-value | 0.03269231 |
| FDR q-value | 1.0 |
| FWER p-Value | 1.0 |
| PROBE | GENE SYMBOL | GENE_TITLE | RANK IN GENE LIST | RANK METRIC SCORE | RUNNING ES | CORE ENRICHMENT | |
|---|---|---|---|---|---|---|---|
| 1 | ATP7A | 6874 | 0.641 | -0.3534 | No | ||
| 2 | LAMP1 | 14791 | -1.675 | -0.7368 | Yes | ||
| 3 | RAB7A | 15394 | -2.085 | -0.7169 | Yes | ||
| 4 | ATP7B | 15425 | -2.108 | -0.6657 | Yes | ||
| 5 | TSG101 | 15645 | -2.287 | -0.6201 | Yes | ||
| 6 | TPT1 | 16046 | -2.716 | -0.5735 | Yes | ||
| 7 | CD79A | 16691 | -3.727 | -0.5146 | Yes | ||
| 8 | RAB14 | 17318 | -5.286 | -0.4157 | Yes | ||
| 9 | LAMP2 | 17336 | -5.349 | -0.2825 | Yes | ||
| 10 | RAB9A | 17653 | -6.380 | -0.1395 | Yes | ||
| 11 | CTNS | 17933 | -7.625 | 0.0367 | Yes |