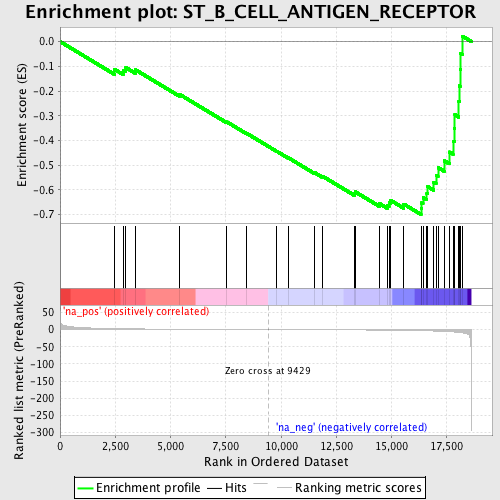
Profile of the Running ES Score & Positions of GeneSet Members on the Rank Ordered List
| Dataset | set04_transDMpreB_versus_WTpreB |
| Phenotype | NoPhenotypeAvailable |
| Upregulated in class | na_neg |
| GeneSet | ST_B_CELL_ANTIGEN_RECEPTOR |
| Enrichment Score (ES) | -0.6992322 |
| Normalized Enrichment Score (NES) | -1.8731819 |
| Nominal p-value | 0.0055350554 |
| FDR q-value | 1.0 |
| FWER p-Value | 0.865 |
| PROBE | GENE SYMBOL | GENE_TITLE | RANK IN GENE LIST | RANK METRIC SCORE | RUNNING ES | CORE ENRICHMENT | |
|---|---|---|---|---|---|---|---|
| 1 | PPP1R13B | 2463 | 2.657 | -0.1121 | No | ||
| 2 | NFKB2 | 2856 | 2.303 | -0.1155 | No | ||
| 3 | AKT1 | 2974 | 2.198 | -0.1049 | No | ||
| 4 | MAP2K1 | 3408 | 1.872 | -0.1138 | No | ||
| 5 | MAP2K2 | 5396 | 1.043 | -0.2127 | No | ||
| 6 | NFAT5 | 7549 | 0.473 | -0.3249 | No | ||
| 7 | ITPKA | 8445 | 0.249 | -0.3711 | No | ||
| 8 | LYN | 9815 | -0.105 | -0.4440 | No | ||
| 9 | SOS1 | 10324 | -0.226 | -0.4696 | No | ||
| 10 | NFKBIB | 11524 | -0.516 | -0.5302 | No | ||
| 11 | PIK3R1 | 11865 | -0.608 | -0.5438 | No | ||
| 12 | EPHB2 | 13319 | -1.058 | -0.6139 | No | ||
| 13 | DAG1 | 13353 | -1.070 | -0.6074 | No | ||
| 14 | BTK | 14460 | -1.507 | -0.6553 | No | ||
| 15 | RAF1 | 14806 | -1.685 | -0.6610 | No | ||
| 16 | SHC1 | 14889 | -1.736 | -0.6520 | No | ||
| 17 | CD19 | 14965 | -1.777 | -0.6424 | No | ||
| 18 | NFKBIL1 | 15549 | -2.202 | -0.6568 | No | ||
| 19 | ITPKB | 16338 | -3.119 | -0.6752 | Yes | ||
| 20 | SOS2 | 16367 | -3.158 | -0.6525 | Yes | ||
| 21 | PIK3CA | 16426 | -3.246 | -0.6306 | Yes | ||
| 22 | PIK3CD | 16600 | -3.558 | -0.6126 | Yes | ||
| 23 | GRB2 | 16640 | -3.636 | -0.5867 | Yes | ||
| 24 | PLCG2 | 16913 | -4.165 | -0.5693 | Yes | ||
| 25 | BLNK | 17018 | -4.436 | -0.5408 | Yes | ||
| 26 | BAD | 17107 | -4.710 | -0.5093 | Yes | ||
| 27 | NFKB1 | 17383 | -5.487 | -0.4819 | Yes | ||
| 28 | NFKBIA | 17625 | -6.306 | -0.4464 | Yes | ||
| 29 | MAPK1 | 17787 | -6.868 | -0.4022 | Yes | ||
| 30 | NFKBIE | 17840 | -7.112 | -0.3503 | Yes | ||
| 31 | BCR | 17868 | -7.264 | -0.2959 | Yes | ||
| 32 | AKT2 | 18046 | -8.193 | -0.2424 | Yes | ||
| 33 | SYK | 18076 | -8.451 | -0.1790 | Yes | ||
| 34 | AKT3 | 18107 | -8.687 | -0.1138 | Yes | ||
| 35 | VAV1 | 18125 | -8.843 | -0.0467 | Yes | ||
| 36 | CSK | 18203 | -9.505 | 0.0222 | Yes |
