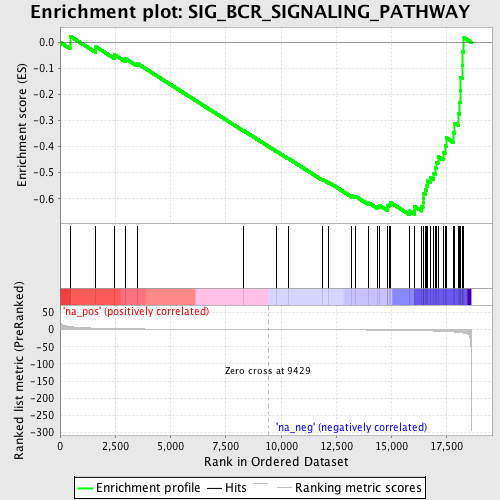
Profile of the Running ES Score & Positions of GeneSet Members on the Rank Ordered List
| Dataset | set04_transDMpreB_versus_WTpreB |
| Phenotype | NoPhenotypeAvailable |
| Upregulated in class | na_neg |
| GeneSet | SIG_BCR_SIGNALING_PATHWAY |
| Enrichment Score (ES) | -0.6602264 |
| Normalized Enrichment Score (NES) | -1.8004489 |
| Nominal p-value | 0.00877193 |
| FDR q-value | 0.93666404 |
| FWER p-Value | 0.955 |
| PROBE | GENE SYMBOL | GENE_TITLE | RANK IN GENE LIST | RANK METRIC SCORE | RUNNING ES | CORE ENRICHMENT | |
|---|---|---|---|---|---|---|---|
| 1 | PDK1 | 451 | 8.727 | 0.0237 | No | ||
| 2 | BCL2 | 1621 | 4.010 | -0.0172 | No | ||
| 3 | PPP1R13B | 2463 | 2.657 | -0.0479 | No | ||
| 4 | AKT1 | 2974 | 2.198 | -0.0633 | No | ||
| 5 | ITPR3 | 3484 | 1.824 | -0.0807 | No | ||
| 6 | ITPR1 | 8317 | 0.274 | -0.3394 | No | ||
| 7 | LYN | 9815 | -0.105 | -0.4194 | No | ||
| 8 | SOS1 | 10324 | -0.226 | -0.4455 | No | ||
| 9 | PIK3R1 | 11865 | -0.608 | -0.5251 | No | ||
| 10 | NFATC2 | 12146 | -0.688 | -0.5364 | No | ||
| 11 | NR0B2 | 13207 | -1.018 | -0.5879 | No | ||
| 12 | DAG1 | 13353 | -1.070 | -0.5898 | No | ||
| 13 | PPP3CA | 13975 | -1.312 | -0.6160 | No | ||
| 14 | GSK3A | 14380 | -1.471 | -0.6297 | No | ||
| 15 | BTK | 14460 | -1.507 | -0.6257 | No | ||
| 16 | RAF1 | 14806 | -1.685 | -0.6350 | No | ||
| 17 | CR2 | 14808 | -1.686 | -0.6258 | No | ||
| 18 | SHC1 | 14889 | -1.736 | -0.6206 | No | ||
| 19 | CD19 | 14965 | -1.777 | -0.6148 | No | ||
| 20 | CD22 | 15809 | -2.447 | -0.6468 | Yes | ||
| 21 | MAP4K1 | 16033 | -2.697 | -0.6440 | Yes | ||
| 22 | ITPR2 | 16048 | -2.720 | -0.6298 | Yes | ||
| 23 | SOS2 | 16367 | -3.158 | -0.6295 | Yes | ||
| 24 | PIK3CA | 16426 | -3.246 | -0.6148 | Yes | ||
| 25 | PTPRC | 16439 | -3.278 | -0.5975 | Yes | ||
| 26 | INPP5D | 16454 | -3.298 | -0.5801 | Yes | ||
| 27 | FLOT2 | 16519 | -3.419 | -0.5647 | Yes | ||
| 28 | PIK3CD | 16600 | -3.558 | -0.5495 | Yes | ||
| 29 | GRB2 | 16640 | -3.636 | -0.5316 | Yes | ||
| 30 | PPP3CB | 16752 | -3.824 | -0.5166 | Yes | ||
| 31 | PLCG2 | 16913 | -4.165 | -0.5023 | Yes | ||
| 32 | PPP3CC | 16975 | -4.313 | -0.4819 | Yes | ||
| 33 | BLNK | 17018 | -4.436 | -0.4598 | Yes | ||
| 34 | BAD | 17107 | -4.710 | -0.4386 | Yes | ||
| 35 | MAPK3 | 17335 | -5.344 | -0.4215 | Yes | ||
| 36 | GSK3B | 17428 | -5.589 | -0.3957 | Yes | ||
| 37 | FLOT1 | 17474 | -5.805 | -0.3663 | Yes | ||
| 38 | MAPK1 | 17787 | -6.868 | -0.3453 | Yes | ||
| 39 | BCR | 17868 | -7.264 | -0.3097 | Yes | ||
| 40 | AKT2 | 18046 | -8.193 | -0.2742 | Yes | ||
| 41 | SYK | 18076 | -8.451 | -0.2293 | Yes | ||
| 42 | AKT3 | 18107 | -8.687 | -0.1832 | Yes | ||
| 43 | VAV1 | 18125 | -8.843 | -0.1355 | Yes | ||
| 44 | CSK | 18203 | -9.505 | -0.0875 | Yes | ||
| 45 | CD81 | 18222 | -9.745 | -0.0349 | Yes | ||
| 46 | NFATC1 | 18277 | -10.197 | 0.0183 | Yes |
