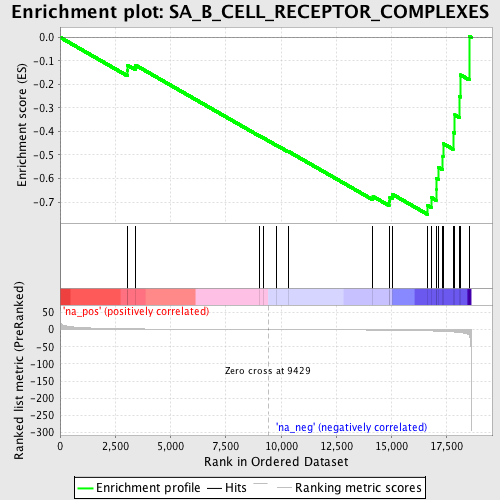
Profile of the Running ES Score & Positions of GeneSet Members on the Rank Ordered List
| Dataset | set04_transDMpreB_versus_WTpreB |
| Phenotype | NoPhenotypeAvailable |
| Upregulated in class | na_neg |
| GeneSet | SA_B_CELL_RECEPTOR_COMPLEXES |
| Enrichment Score (ES) | -0.75280887 |
| Normalized Enrichment Score (NES) | -1.8446897 |
| Nominal p-value | 0.0057034222 |
| FDR q-value | 0.9462461 |
| FWER p-Value | 0.916 |
| PROBE | GENE SYMBOL | GENE_TITLE | RANK IN GENE LIST | RANK METRIC SCORE | RUNNING ES | CORE ENRICHMENT | |
|---|---|---|---|---|---|---|---|
| 1 | MAPK8IP3 | 3043 | 2.139 | -0.1409 | No | ||
| 2 | RPS6KA1 | 3055 | 2.134 | -0.1189 | No | ||
| 3 | MAP2K1 | 3408 | 1.872 | -0.1179 | No | ||
| 4 | FOS | 9018 | 0.107 | -0.4185 | No | ||
| 5 | HRAS | 9216 | 0.053 | -0.4285 | No | ||
| 6 | LYN | 9815 | -0.105 | -0.4595 | No | ||
| 7 | SOS1 | 10324 | -0.226 | -0.4845 | No | ||
| 8 | PAPPA | 14160 | -1.382 | -0.6760 | No | ||
| 9 | SHC1 | 14889 | -1.736 | -0.6968 | No | ||
| 10 | RAC1 | 14926 | -1.756 | -0.6801 | No | ||
| 11 | VAV2 | 15039 | -1.820 | -0.6668 | No | ||
| 12 | GRB2 | 16640 | -3.636 | -0.7142 | Yes | ||
| 13 | ATF2 | 16819 | -3.962 | -0.6817 | Yes | ||
| 14 | BLNK | 17018 | -4.436 | -0.6453 | Yes | ||
| 15 | MAP3K1 | 17023 | -4.458 | -0.5982 | Yes | ||
| 16 | JUN | 17135 | -4.762 | -0.5536 | Yes | ||
| 17 | RPS6KA3 | 17324 | -5.301 | -0.5074 | Yes | ||
| 18 | MAPK3 | 17335 | -5.344 | -0.4512 | Yes | ||
| 19 | MAPK1 | 17787 | -6.868 | -0.4026 | Yes | ||
| 20 | BCR | 17868 | -7.264 | -0.3298 | Yes | ||
| 21 | SYK | 18076 | -8.451 | -0.2512 | Yes | ||
| 22 | VAV1 | 18125 | -8.843 | -0.1599 | Yes | ||
| 23 | VAV3 | 18521 | -17.543 | 0.0051 | Yes |