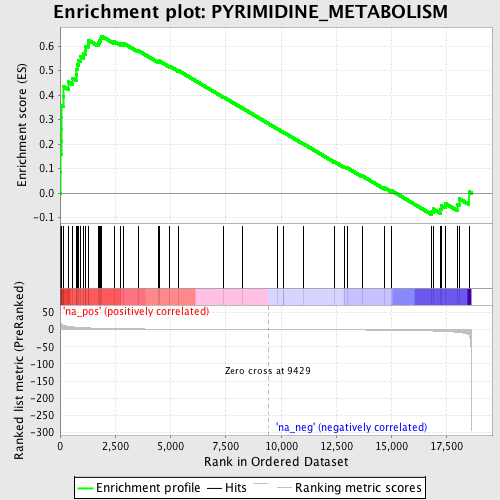
Profile of the Running ES Score & Positions of GeneSet Members on the Rank Ordered List
| Dataset | set04_transDMpreB_versus_WTpreB |
| Phenotype | NoPhenotypeAvailable |
| Upregulated in class | na_pos |
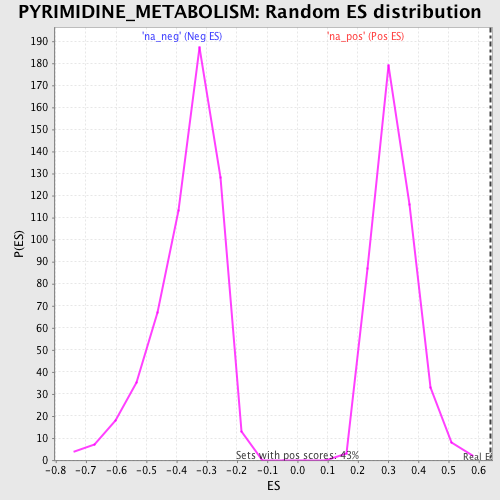
| GeneSet | PYRIMIDINE_METABOLISM |
| Enrichment Score (ES) | 0.6404777 |
| Normalized Enrichment Score (NES) | 1.9928684 |
| Nominal p-value | 0.0 |
| FDR q-value | 9.413442E-4 |
| FWER p-Value | 0.0090 |
| PROBE | GENE SYMBOL | GENE_TITLE | RANK IN GENE LIST | RANK METRIC SCORE | RUNNING ES | CORE ENRICHMENT | |
|---|---|---|---|---|---|---|---|
| 1 | POLR1B | 13 | 25.660 | 0.0837 | Yes | ||
| 2 | DCTD | 18 | 22.484 | 0.1575 | Yes | ||
| 3 | CTPS | 55 | 16.537 | 0.2100 | Yes | ||
| 4 | CAD | 74 | 15.227 | 0.2591 | Yes | ||
| 5 | NME2 | 80 | 14.966 | 0.3081 | Yes | ||
| 6 | NME1 | 84 | 14.861 | 0.3569 | Yes | ||
| 7 | POLD2 | 156 | 12.471 | 0.3941 | Yes | ||
| 8 | POLE | 169 | 12.131 | 0.4334 | Yes | ||
| 9 | UNG | 369 | 9.391 | 0.4536 | Yes | ||
| 10 | POLR2J | 575 | 7.790 | 0.4681 | Yes | ||
| 11 | TK1 | 724 | 6.898 | 0.4829 | Yes | ||
| 12 | UMPS | 751 | 6.770 | 0.5038 | Yes | ||
| 13 | POLR2H | 779 | 6.679 | 0.5243 | Yes | ||
| 14 | DHODH | 847 | 6.398 | 0.5417 | Yes | ||
| 15 | NT5E | 917 | 6.120 | 0.5582 | Yes | ||
| 16 | POLL | 1065 | 5.547 | 0.5685 | Yes | ||
| 17 | RRM1 | 1140 | 5.328 | 0.5820 | Yes | ||
| 18 | POLR2E | 1154 | 5.265 | 0.5987 | Yes | ||
| 19 | NUDT2 | 1265 | 4.922 | 0.6089 | Yes | ||
| 20 | POLG | 1293 | 4.860 | 0.6235 | Yes | ||
| 21 | UCK1 | 1725 | 3.813 | 0.6128 | Yes | ||
| 22 | POLQ | 1796 | 3.669 | 0.6211 | Yes | ||
| 23 | POLR2A | 1817 | 3.619 | 0.6320 | Yes | ||
| 24 | TXNRD1 | 1874 | 3.508 | 0.6405 | Yes | ||
| 25 | ECGF1 | 2450 | 2.669 | 0.6183 | No | ||
| 26 | POLRMT | 2721 | 2.416 | 0.6117 | No | ||
| 27 | DTYMK | 2874 | 2.284 | 0.6110 | No | ||
| 28 | POLR2K | 3525 | 1.806 | 0.5820 | No | ||
| 29 | POLR2I | 4456 | 1.372 | 0.5364 | No | ||
| 30 | POLS | 4484 | 1.356 | 0.5394 | No | ||
| 31 | AK3L1 | 4952 | 1.179 | 0.5181 | No | ||
| 32 | ITPA | 5342 | 1.069 | 0.5007 | No | ||
| 33 | ENTPD1 | 7391 | 0.516 | 0.3921 | No | ||
| 34 | POLR2C | 8238 | 0.292 | 0.3475 | No | ||
| 35 | NP | 9843 | -0.112 | 0.2614 | No | ||
| 36 | CANT1 | 10095 | -0.177 | 0.2485 | No | ||
| 37 | DPYD | 10120 | -0.182 | 0.2478 | No | ||
| 38 | UPB1 | 11025 | -0.391 | 0.2004 | No | ||
| 39 | CDA | 12427 | -0.773 | 0.1275 | No | ||
| 40 | DPYS | 12887 | -0.913 | 0.1057 | No | ||
| 41 | POLR2G | 12990 | -0.941 | 0.1033 | No | ||
| 42 | UPP1 | 13665 | -1.197 | 0.0710 | No | ||
| 43 | POLR2B | 14675 | -1.616 | 0.0219 | No | ||
| 44 | NT5C | 15011 | -1.805 | 0.0098 | No | ||
| 45 | POLD1 | 16812 | -3.942 | -0.0741 | No | ||
| 46 | NT5M | 16885 | -4.101 | -0.0645 | No | ||
| 47 | POLB | 17210 | -4.968 | -0.0656 | No | ||
| 48 | CTPS2 | 17266 | -5.140 | -0.0517 | No | ||
| 49 | RRM2 | 17427 | -5.575 | -0.0419 | No | ||
| 50 | DCK | 17991 | -7.855 | -0.0464 | No | ||
| 51 | TYMS | 18075 | -8.443 | -0.0231 | No | ||
| 52 | TK2 | 18506 | -15.859 | 0.0059 | No |