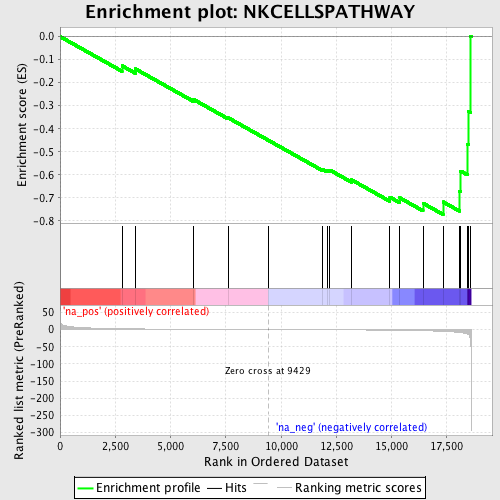
Profile of the Running ES Score & Positions of GeneSet Members on the Rank Ordered List
| Dataset | set04_transDMpreB_versus_WTpreB |
| Phenotype | NoPhenotypeAvailable |
| Upregulated in class | na_neg |
| GeneSet | NKCELLSPATHWAY |
| Enrichment Score (ES) | -0.7722412 |
| Normalized Enrichment Score (NES) | -1.754683 |
| Nominal p-value | 0.027290449 |
| FDR q-value | 0.7013896 |
| FWER p-Value | 0.982 |
| PROBE | GENE SYMBOL | GENE_TITLE | RANK IN GENE LIST | RANK METRIC SCORE | RUNNING ES | CORE ENRICHMENT | |
|---|---|---|---|---|---|---|---|
| 1 | ITGB1 | 2804 | 2.343 | -0.1269 | No | ||
| 2 | MAP2K1 | 3408 | 1.872 | -0.1402 | No | ||
| 3 | PAK1 | 6045 | 0.855 | -0.2732 | No | ||
| 4 | KLRC1 | 7617 | 0.453 | -0.3530 | No | ||
| 5 | LAT | 9409 | 0.005 | -0.4493 | No | ||
| 6 | PIK3R1 | 11865 | -0.608 | -0.5751 | No | ||
| 7 | KLRC2 | 12087 | -0.673 | -0.5801 | No | ||
| 8 | KLRC3 | 12204 | -0.704 | -0.5792 | No | ||
| 9 | KLRD1 | 13195 | -1.016 | -0.6220 | No | ||
| 10 | RAC1 | 14926 | -1.756 | -0.6971 | No | ||
| 11 | B2M | 15376 | -2.073 | -0.7001 | No | ||
| 12 | PIK3CA | 16426 | -3.246 | -0.7234 | Yes | ||
| 13 | MAPK3 | 17335 | -5.344 | -0.7177 | Yes | ||
| 14 | SYK | 18076 | -8.451 | -0.6713 | Yes | ||
| 15 | VAV1 | 18125 | -8.843 | -0.5837 | Yes | ||
| 16 | PTPN6 | 18441 | -13.086 | -0.4671 | Yes | ||
| 17 | PTK2B | 18476 | -14.219 | -0.3239 | Yes | ||
| 18 | IL18 | 18578 | -32.489 | 0.0020 | Yes |