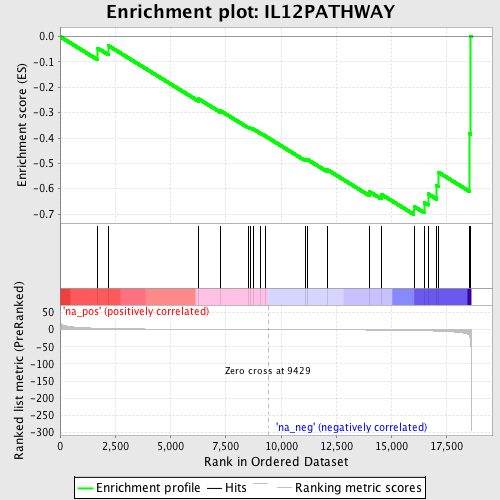
Profile of the Running ES Score & Positions of GeneSet Members on the Rank Ordered List
| Dataset | set04_transDMpreB_versus_WTpreB |
| Phenotype | NoPhenotypeAvailable |
| Upregulated in class | na_neg |
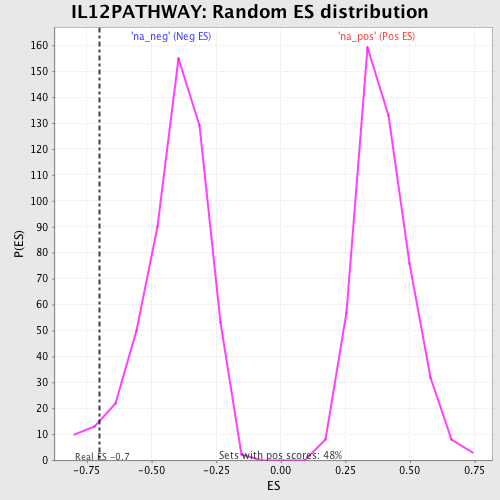
| GeneSet | IL12PATHWAY |
| Enrichment Score (ES) | -0.7017728 |
| Normalized Enrichment Score (NES) | -1.6934286 |
| Nominal p-value | 0.03244275 |
| FDR q-value | 0.561079 |
| FWER p-Value | 0.998 |
| PROBE | GENE SYMBOL | GENE_TITLE | RANK IN GENE LIST | RANK METRIC SCORE | RUNNING ES | CORE ENRICHMENT | |
|---|---|---|---|---|---|---|---|
| 1 | IL12RB1 | 1706 | 3.848 | -0.0459 | No | ||
| 2 | MAPK8 | 2179 | 3.027 | -0.0352 | No | ||
| 3 | IL18R1 | 6272 | 0.794 | -0.2458 | No | ||
| 4 | CCR5 | 7247 | 0.550 | -0.2916 | No | ||
| 5 | CD3E | 8523 | 0.227 | -0.3575 | No | ||
| 6 | CD3G | 8635 | 0.200 | -0.3611 | No | ||
| 7 | IL12B | 8737 | 0.175 | -0.3644 | No | ||
| 8 | CXCR3 | 9089 | 0.088 | -0.3822 | No | ||
| 9 | CD3D | 9273 | 0.038 | -0.3916 | No | ||
| 10 | IL12RB2 | 11116 | -0.413 | -0.4857 | No | ||
| 11 | STAT4 | 11183 | -0.430 | -0.4842 | No | ||
| 12 | TRB@ | 12085 | -0.673 | -0.5246 | No | ||
| 13 | TYK2 | 14000 | -1.321 | -0.6118 | No | ||
| 14 | MAPK14 | 14537 | -1.541 | -0.6222 | No | ||
| 15 | MAP2K6 | 16017 | -2.684 | -0.6698 | Yes | ||
| 16 | IFNG | 16475 | -3.329 | -0.6547 | Yes | ||
| 17 | JAK2 | 16656 | -3.667 | -0.6207 | Yes | ||
| 18 | IL12A | 17038 | -4.515 | -0.5874 | Yes | ||
| 19 | JUN | 17135 | -4.762 | -0.5358 | Yes | ||
| 20 | ETV5 | 18537 | -19.144 | -0.3830 | Yes | ||
| 21 | IL18 | 18578 | -32.489 | 0.0020 | Yes |