Profile of the Running ES Score & Positions of GeneSet Members on the Rank Ordered List
| Dataset | set04_transDMpreB_versus_WTpreB |
| Phenotype | NoPhenotypeAvailable |
| Upregulated in class | na_neg |
| GeneSet | HSA04130_SNARE_INTERACTIONS_IN_VESICULAR_TRANSPORT |
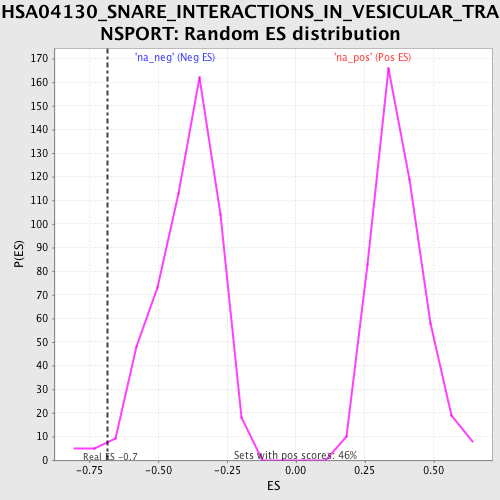
| Enrichment Score (ES) | -0.6842745 |
| Normalized Enrichment Score (NES) | -1.7158736 |
| Nominal p-value | 0.020484172 |
| FDR q-value | 0.60338163 |
| FWER p-Value | 0.995 |
| PROBE | GENE SYMBOL | GENE_TITLE | RANK IN GENE LIST | RANK METRIC SCORE | RUNNING ES | CORE ENRICHMENT | |
|---|---|---|---|---|---|---|---|
| 1 | VTI1A | 1790 | 3.694 | -0.0643 | No | ||
| 2 | STX4 | 3176 | 2.047 | -0.1211 | No | ||
| 3 | VTI1B | 3380 | 1.890 | -0.1156 | No | ||
| 4 | STX11 | 3522 | 1.808 | -0.1076 | No | ||
| 5 | BNIP1 | 4288 | 1.434 | -0.1363 | No | ||
| 6 | STX18 | 5112 | 1.136 | -0.1707 | No | ||
| 7 | VAMP1 | 6078 | 0.845 | -0.2153 | No | ||
| 8 | STX17 | 6134 | 0.830 | -0.2111 | No | ||
| 9 | STX16 | 6709 | 0.684 | -0.2361 | No | ||
| 10 | STX12 | 8809 | 0.160 | -0.3476 | No | ||
| 11 | VAMP2 | 9194 | 0.058 | -0.3678 | No | ||
| 12 | BET1 | 10651 | -0.294 | -0.4436 | No | ||
| 13 | STX3 | 14248 | -1.417 | -0.6247 | No | ||
| 14 | SEC22B | 14766 | -1.661 | -0.6382 | No | ||
| 15 | GOSR1 | 14891 | -1.737 | -0.6298 | No | ||
| 16 | STX6 | 15414 | -2.097 | -0.6397 | No | ||
| 17 | SNAP25 | 15496 | -2.161 | -0.6254 | No | ||
| 18 | STX2 | 16592 | -3.548 | -0.6536 | Yes | ||
| 19 | STX8 | 16623 | -3.601 | -0.6240 | Yes | ||
| 20 | VAMP3 | 16638 | -3.630 | -0.5933 | Yes | ||
| 21 | VAMP8 | 17486 | -5.835 | -0.5883 | Yes | ||
| 22 | STX7 | 17572 | -6.127 | -0.5399 | Yes | ||
| 23 | SNAP23 | 17885 | -7.362 | -0.4929 | Yes | ||
| 24 | GOSR2 | 18040 | -8.140 | -0.4307 | Yes | ||
| 25 | SNAP29 | 18048 | -8.213 | -0.3599 | Yes | ||
| 26 | STX5 | 18265 | -10.085 | -0.2842 | Yes | ||
| 27 | VAMP5 | 18340 | -11.182 | -0.1914 | Yes | ||
| 28 | VAMP4 | 18346 | -11.253 | -0.0942 | Yes | ||
| 29 | BET1L | 18411 | -12.546 | 0.0110 | Yes |