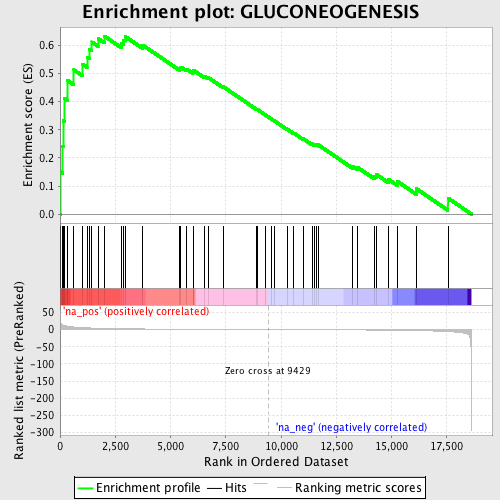
Profile of the Running ES Score & Positions of GeneSet Members on the Rank Ordered List
| Dataset | set04_transDMpreB_versus_WTpreB |
| Phenotype | NoPhenotypeAvailable |
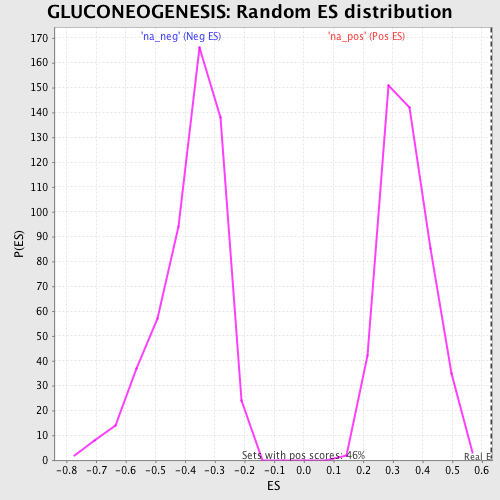
| Upregulated in class | na_pos |
| GeneSet | GLUCONEOGENESIS |
| Enrichment Score (ES) | 0.6333307 |
| Normalized Enrichment Score (NES) | 1.842892 |
| Nominal p-value | 0.0 |
| FDR q-value | 0.009304797 |
| FWER p-Value | 0.169 |
| PROBE | GENE SYMBOL | GENE_TITLE | RANK IN GENE LIST | RANK METRIC SCORE | RUNNING ES | CORE ENRICHMENT | |
|---|---|---|---|---|---|---|---|
| 1 | HK2 | 22 | 21.234 | 0.1511 | Yes | ||
| 2 | LDHA | 123 | 13.322 | 0.2413 | Yes | ||
| 3 | TPI1 | 143 | 12.831 | 0.3323 | Yes | ||
| 4 | GAPDH | 194 | 11.520 | 0.4122 | Yes | ||
| 5 | PKM2 | 328 | 9.829 | 0.4756 | Yes | ||
| 6 | PFKM | 624 | 7.440 | 0.5131 | Yes | ||
| 7 | PGAM1 | 1011 | 5.786 | 0.5338 | Yes | ||
| 8 | PFKP | 1220 | 5.049 | 0.5588 | Yes | ||
| 9 | PGK1 | 1338 | 4.727 | 0.5864 | Yes | ||
| 10 | DLD | 1442 | 4.400 | 0.6124 | Yes | ||
| 11 | ENO1 | 1722 | 3.819 | 0.6248 | Yes | ||
| 12 | ALDH3B1 | 2003 | 3.292 | 0.6333 | Yes | ||
| 13 | ALDH2 | 2776 | 2.370 | 0.6088 | No | ||
| 14 | ENO3 | 2882 | 2.278 | 0.6194 | No | ||
| 15 | PGM3 | 2948 | 2.216 | 0.6318 | No | ||
| 16 | ADH4 | 3745 | 1.683 | 0.6011 | No | ||
| 17 | LDHC | 5422 | 1.036 | 0.5183 | No | ||
| 18 | HK3 | 5465 | 1.023 | 0.5233 | No | ||
| 19 | DLAT | 5722 | 0.948 | 0.5163 | No | ||
| 20 | ALDH1A2 | 6016 | 0.863 | 0.5068 | No | ||
| 21 | GCK | 6038 | 0.858 | 0.5118 | No | ||
| 22 | ALDH1A3 | 6540 | 0.727 | 0.4900 | No | ||
| 23 | ALDH3A1 | 6708 | 0.684 | 0.4859 | No | ||
| 24 | ALDH1A1 | 7392 | 0.516 | 0.4529 | No | ||
| 25 | ALDOC | 8884 | 0.141 | 0.3736 | No | ||
| 26 | ENO2 | 8927 | 0.131 | 0.3723 | No | ||
| 27 | ALDH9A1 | 9316 | 0.028 | 0.3516 | No | ||
| 28 | FBP2 | 9565 | -0.038 | 0.3385 | No | ||
| 29 | ADH7 | 9701 | -0.072 | 0.3318 | No | ||
| 30 | ACYP2 | 10288 | -0.218 | 0.3018 | No | ||
| 31 | ADH1A | 10573 | -0.279 | 0.2885 | No | ||
| 32 | PKLR | 10999 | -0.383 | 0.2683 | No | ||
| 33 | PDHA2 | 11402 | -0.484 | 0.2502 | No | ||
| 34 | ALDOA | 11523 | -0.516 | 0.2474 | No | ||
| 35 | G6PC | 11615 | -0.538 | 0.2464 | No | ||
| 36 | HK1 | 11692 | -0.560 | 0.2463 | No | ||
| 37 | FBP1 | 13234 | -1.027 | 0.1707 | No | ||
| 38 | PGM1 | 13471 | -1.116 | 0.1660 | No | ||
| 39 | BPGM | 14224 | -1.408 | 0.1356 | No | ||
| 40 | PDHB | 14319 | -1.447 | 0.1409 | No | ||
| 41 | ALDOB | 14853 | -1.716 | 0.1245 | No | ||
| 42 | ADHFE1 | 15258 | -1.979 | 0.1170 | No | ||
| 43 | PDHA1 | 16118 | -2.801 | 0.0908 | No | ||
| 44 | ALDH1B1 | 17556 | -6.085 | 0.0571 | No |