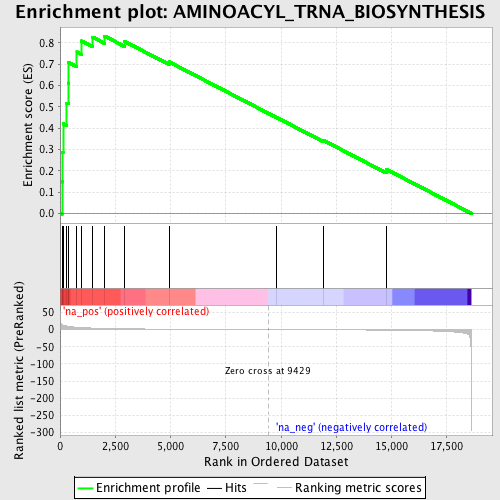
Profile of the Running ES Score & Positions of GeneSet Members on the Rank Ordered List
| Dataset | set04_transDMpreB_versus_WTpreB |
| Phenotype | NoPhenotypeAvailable |
| Upregulated in class | na_pos |
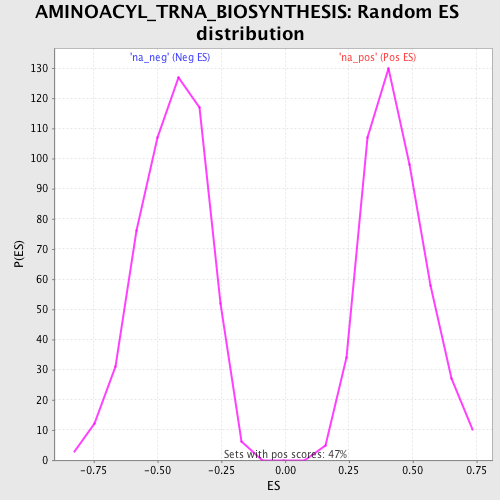
| GeneSet | AMINOACYL_TRNA_BIOSYNTHESIS |
| Enrichment Score (ES) | 0.831534 |
| Normalized Enrichment Score (NES) | 1.941586 |
| Nominal p-value | 0.0 |
| FDR q-value | 0.0022478239 |
| FWER p-Value | 0.029 |
| PROBE | GENE SYMBOL | GENE_TITLE | RANK IN GENE LIST | RANK METRIC SCORE | RUNNING ES | CORE ENRICHMENT | |
|---|---|---|---|---|---|---|---|
| 1 | RARS | 87 | 14.769 | 0.1492 | Yes | ||
| 2 | KARS | 120 | 13.381 | 0.2869 | Yes | ||
| 3 | GARS | 136 | 12.986 | 0.4214 | Yes | ||
| 4 | CARS | 302 | 10.071 | 0.5174 | Yes | ||
| 5 | LARS2 | 368 | 9.395 | 0.6118 | Yes | ||
| 6 | DARS | 389 | 9.252 | 0.7071 | Yes | ||
| 7 | TARS | 763 | 6.734 | 0.7572 | Yes | ||
| 8 | NARS | 959 | 5.958 | 0.8088 | Yes | ||
| 9 | IARS | 1471 | 4.349 | 0.8266 | Yes | ||
| 10 | YARS | 2016 | 3.277 | 0.8315 | Yes | ||
| 11 | WARS | 2907 | 2.254 | 0.8072 | No | ||
| 12 | WARS2 | 4934 | 1.185 | 0.7106 | No | ||
| 13 | EPRS | 9772 | -0.091 | 0.4515 | No | ||
| 14 | HARS | 11918 | -0.624 | 0.3427 | No | ||
| 15 | FARS2 | 14761 | -1.660 | 0.2072 | No |