Profile of the Running ES Score & Positions of GeneSet Members on the Rank Ordered List
| Dataset | set04_transDMpreB_versus_WTpreB |
| Phenotype | NoPhenotypeAvailable |
| Upregulated in class | na_pos |
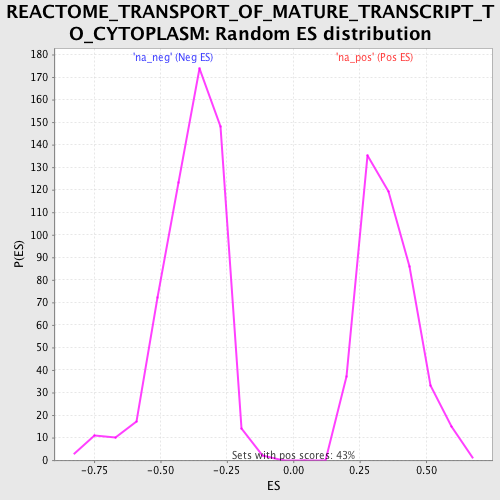
| GeneSet | REACTOME_TRANSPORT_OF_MATURE_TRANSCRIPT_TO_CYTOPLASM |
| Enrichment Score (ES) | 0.8356836 |
| Normalized Enrichment Score (NES) | 2.3361194 |
| Nominal p-value | 0.0 |
| FDR q-value | 0.0 |
| FWER p-Value | 0.0 |
| PROBE | GENE SYMBOL | GENE_TITLE | RANK IN GENE LIST | RANK METRIC SCORE | RUNNING ES | CORE ENRICHMENT | |
|---|---|---|---|---|---|---|---|
| 1 | NUP93 | 158 | 12.362 | 0.0598 | Yes | ||
| 2 | NUP43 | 179 | 11.857 | 0.1242 | Yes | ||
| 3 | U2AF1 | 184 | 11.817 | 0.1893 | Yes | ||
| 4 | CPSF1 | 260 | 10.576 | 0.2437 | Yes | ||
| 5 | SFRS6 | 261 | 10.573 | 0.3021 | Yes | ||
| 6 | NUPL2 | 289 | 10.270 | 0.3574 | Yes | ||
| 7 | RAE1 | 342 | 9.648 | 0.4079 | Yes | ||
| 8 | THOC4 | 364 | 9.426 | 0.4588 | Yes | ||
| 9 | NUP107 | 365 | 9.417 | 0.5108 | Yes | ||
| 10 | RNPS1 | 641 | 7.339 | 0.5366 | Yes | ||
| 11 | NUP37 | 746 | 6.784 | 0.5684 | Yes | ||
| 12 | NUP155 | 834 | 6.477 | 0.5995 | Yes | ||
| 13 | NCBP2 | 887 | 6.207 | 0.6310 | Yes | ||
| 14 | SFRS5 | 921 | 6.090 | 0.6629 | Yes | ||
| 15 | EIF4E | 1095 | 5.466 | 0.6838 | Yes | ||
| 16 | NUP54 | 1098 | 5.452 | 0.7138 | Yes | ||
| 17 | RANBP2 | 1289 | 4.869 | 0.7305 | Yes | ||
| 18 | MAGOH | 1375 | 4.593 | 0.7513 | Yes | ||
| 19 | NUP62 | 1384 | 4.574 | 0.7761 | Yes | ||
| 20 | SFRS2 | 1866 | 3.517 | 0.7697 | Yes | ||
| 21 | NFX1 | 1903 | 3.450 | 0.7868 | Yes | ||
| 22 | NUP160 | 1950 | 3.381 | 0.8030 | Yes | ||
| 23 | TPR | 2057 | 3.210 | 0.8150 | Yes | ||
| 24 | SFRS1 | 2175 | 3.032 | 0.8255 | Yes | ||
| 25 | SFRS9 | 2349 | 2.793 | 0.8316 | Yes | ||
| 26 | SFRS3 | 2539 | 2.582 | 0.8357 | Yes | ||
| 27 | U2AF2 | 4166 | 1.488 | 0.7564 | No | ||
| 28 | SLBP | 5419 | 1.037 | 0.6948 | No | ||
| 29 | SFRS7 | 6937 | 0.624 | 0.6166 | No | ||
| 30 | NUP35 | 8007 | 0.356 | 0.5610 | No | ||
| 31 | NUP153 | 9802 | -0.101 | 0.4651 | No | ||
| 32 | SRRM1 | 11871 | -0.610 | 0.3571 | No | ||
| 33 | NUP188 | 13273 | -1.040 | 0.2875 | No |